
Figure 6 through Figure 10 illustrate the distribution of projects by the types of roads on which they were conducted. Figure 6 shows number of projects by functional class, following the HPMS classification scheme; Figure 7 shows average total cost of projects by functional class; Figure 8 shows the number and average total cost of projects by urban/rural designation; Figure 9 shows projects by the agency who owns the road; and Figure 10 shows average total cost of projects by the agency who owns the road. If the functional class or road ownership was not indicated, the project is counted under the "unknown" category. Examples of classifications in the "other" category include multiple functional classes, state or citywide implementation, or non-infrastructure projects.
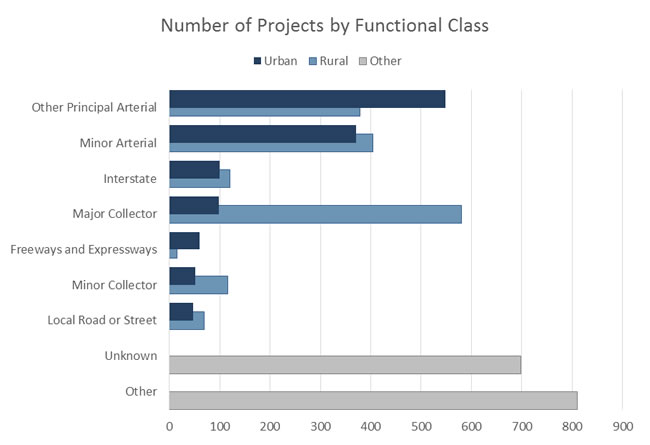
Figure 6: Number of Projects by Functional Class
Unlike 2014 and 2015, most projects were categorized as "Other" indicating that the State classified the project as multiple functional classes, state or citywide implementation, or non-infrastructure projects (810 projects). As in 2015, projects that were associated with a functional class were most often categorized as "Rural Major Collector" or "Urban Principal Arterial – Other". There were 698 projects categorized as "Unknown" indicating the State did not assign a functional classification to the project.
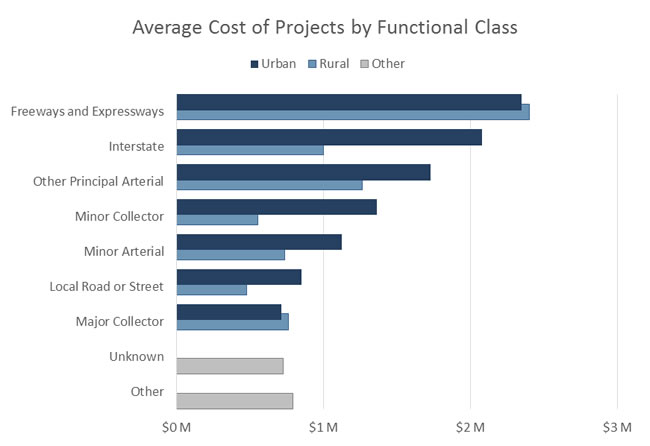
Figure 7: Average Total Cost of Projects by Functional Class
Figure 7 shows the average total cost of projects by functional class. It is important to note that not every project had an associated cost so the average is based on the number of projects which had cost information available (including de-obligated costs). Projects categorized as "Rural Principal Arterial – Freeways and Expressways" had the highest average total cost per project of $2.4 million (compared to $2.7M in 2015) and projects categorized as "Rural Local Road or Street" had the lowest average total cost per project of $475,000 (compared to $329,000 in 2015).
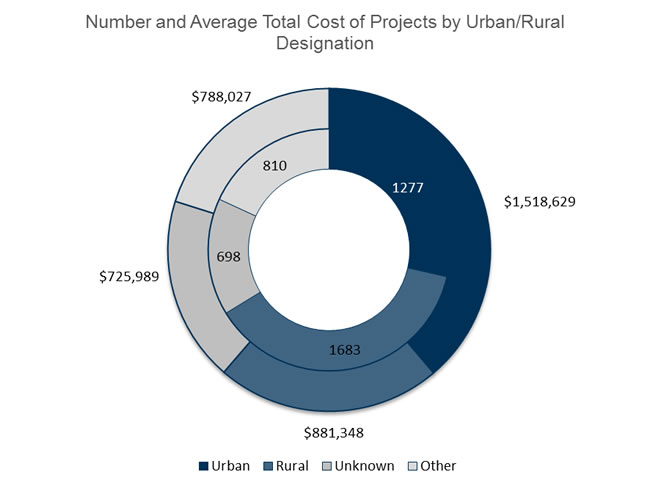
Figure 8: Number and Average Total Cost of Projects by Urban/Rural Designation
Figure 8 illustrates the number and average total cost of projects by urban/rural designation. As in 2014 and 2015, there are fewer total urban projects than rural projects but the average total cost of the urban projects is greater than the average total cost of the rural projects.
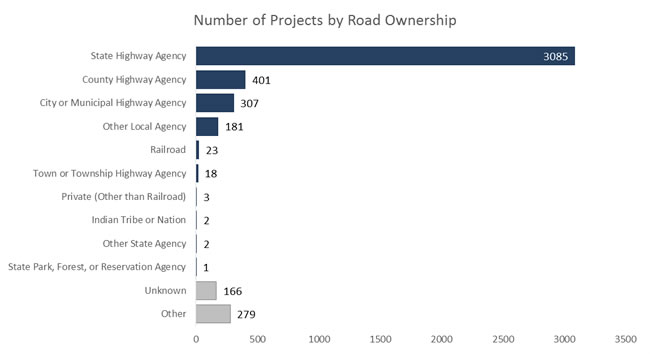
Figure 9: Number of Projects by Road Ownership
As in 2014 and 2015, States implement most projects on roads owned by a "State Highway Agency". There were 166 projects categorized as "Unknown" (indicating that the State did not indicate road ownership for a particular project). There were 279 projects categorized as "Other" and of those, roughly 70 were categorized in state-defined ownership categories. No projects were categorized for the following ownerships:
- Local Park, Forest, or Reservation Agency
- State Toll Authority
- Local Toll Authority
- Other Public Instrumentality
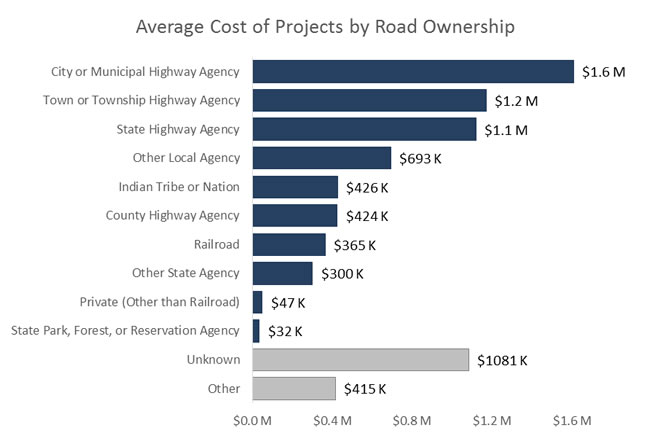
Figure 10: Average Total Cost of Projects by Road Ownership
Figure 10 shows the average total cost of projects by road ownership. It is important to note that not every project had an associated cost so the average is based on the number of projects which had cost information available (including deobligated costs). Projects categorized as "City or Municipal Highway Agency" had the highest average total cost per project of $1.6 million and projects categorized as "State Park, Forest, or Reservation Agency" had the lowest average total cost per project of $32,000.