
Under the HSIP MAP-21 reporting guidance, each project should be assigned a general improvement category and a subcategory under that general category. While a single project may consist of multiple project types, FHWA suggests States to assign each project to only one category. The category chosen should align with the primary purpose of the project. Figure 11 and Figure 12 show the distribution of the number of projects by general improvement category. Figure 13 and Figure 14 combined show the distribution of the total cost of projects by general improvement category. Projects categorized as "Unknown" indicate that there was no general improvement category assigned by the State. Figure 15 through Figure 19 show the breakdown of the number of projects by subcategory for five improvement categories: Intersection geometry, Intersection traffic control, Pedestrians and bicyclists, Roadway, and Roadside. More detailed tables with the cost spent in each subcategory are available in Appendix B. For ease of reporting, similar subcategories were grouped together. For example, in Figure 15 below, "Auxiliary lanes – other" combines adding acceleration lanes, adding auxiliary through lanes, adding two way left turn lanes, and several other related subcategories.
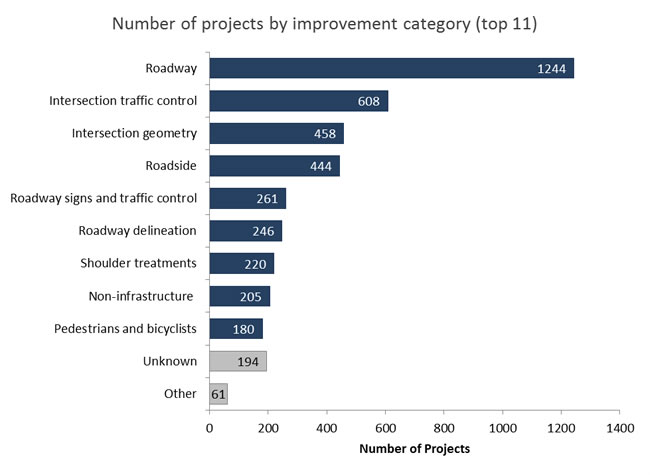
Figure 11: Number of Projects by Improvement Category (Top 11)
Figure 11 shows the number of projects by improvement category (top 11) as classified in the HSIP MAP-21 Reporting Guidance. Based on the project information reported by the States, the top five improvement categories are roadway, intersection traffic control, intersection geometry, roadside, and roadway signs and traffic control. In 2015, the top five improvement categories were the same with the exception of roadway signs and traffic control (shoulder treatments was the fifth most classified improvement category in 2015). The number of projects classified in each category and the ranking of project categories were similar, also, compared to 2015.
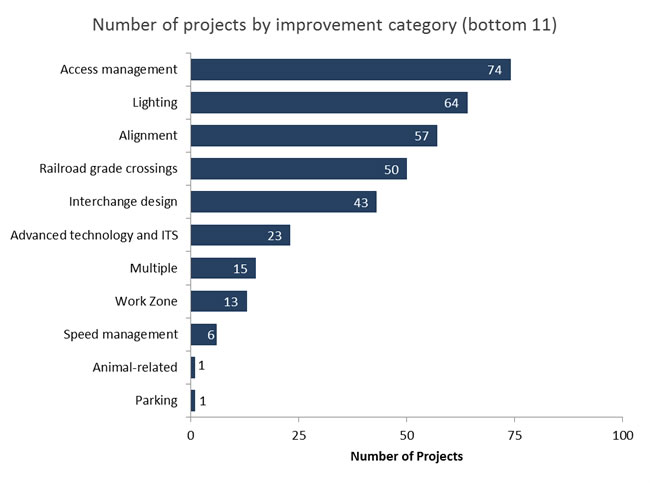
Figure 12: Number of Projects by Improvement Category (Bottom 11)
Figure 12 shows the number of projects by improvement category (bottom 11) as classified in the HSIP MAP-21 Reporting Guidance. In 2015, the number and ranking of projects classified in each category for the bottom 11 were similar with the exception of railroad grade crossings. In 2016, 50 projects were classified as railroad grade crossings compared to 18 projects in 2015.
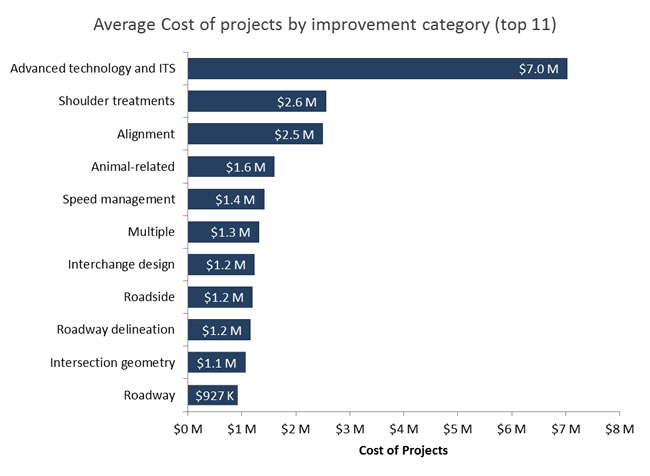
Figure 13: Average Total Cost of Projects by Improvement Category (top 11)
Figure 13 shows the average total cost of projects by improvement category (top 11). Again, it is important to note that not every project had an associated cost so the average is based on the number of projects with cost available (including deobligated costs). Compared to 2015, the following categories had notable differences in average project costs. Note that the "Multiple" category indicates that a State selected more than one improvement category. For example, the project could include changes to intersection geometry, traffic control, pedestrian access, signs, or pavement markings).
- Railroad grade crossings – moved from the top 11 in 2015 to the bottom 11 in 2016 (decreased from $1.7M in 2015 to $574K in 2016)
- Parking – moved from the top 11 in 2015 to the bottom 11 in 2016 (decreased from $1.4M in 2015 to $245K in 2016)
- Pedestrians and bicyclists – moved from the top 11 in 2015 to the bottom 11 in 2016 (decreased from $965K in 2015 to $866K in 2016)
- Multiple – moved from the bottom 11 in 2015 to the top 11 in 2016 (increased from $190K in 2015 to $1.3M in 2016)
- Speed management – moved from the bottom 11 in 2015 to the top 11 in 2016 (increased from $378K in 2015 to $1.4M in 2016)
- Roadway – moved from the bottom 11 in 2015 to the top 11 in 2016 (increased from $608K in 2015 to $927K in 2016)
- Advanced technology and ITS – remained in the top 11 for 2016 but with much higher average cost (increased from $2.8M in 2015 to $7.0M in 2016)
- Animal related – remained in the top 11 for 2016 but with much lower average cost (decreased from $7.5M in 2015 to $1.6M in 2016)
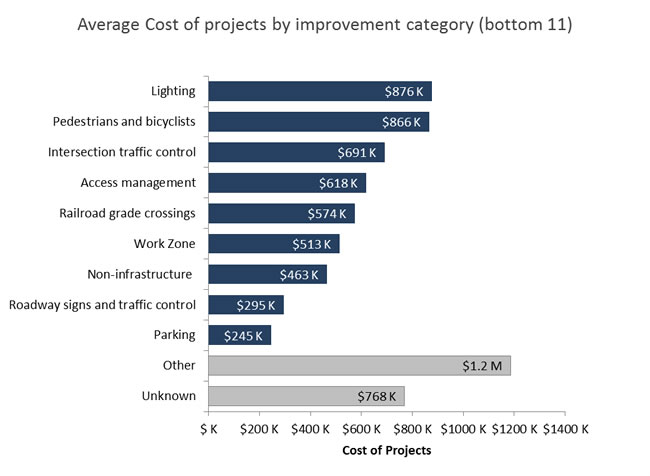
Figure 14: Average Total Cost of Projects by Improvement Category (bottom 11)
Based on project information reported by the States, the lowest average HSIP cost projects are in the following categories:
- Railroad grade crossings; 30 projects with cost information
- Work Zone; 13 projects with cost information
- Non-infrastructure; 181 projects with cost information
- Roadway signs and traffic control; 239 projects with cost information
- Parking; 1 project with cost information
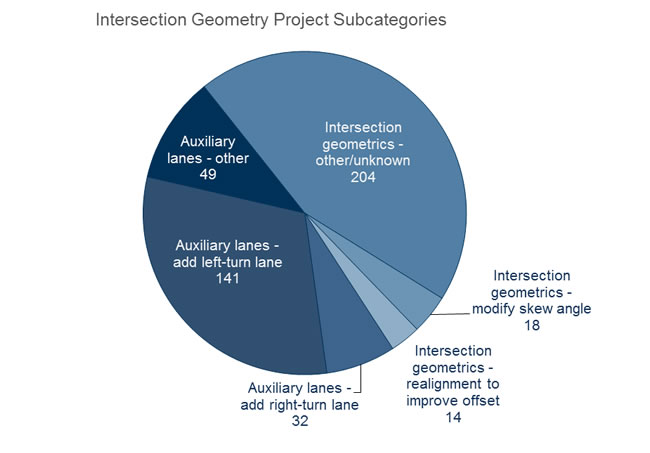
Figure 15: Number of Intersection Geometry Projects by Subcategory
The Intersection geometry category was selected for further evaluation because in 2016 (as in previous years) it ranked in the top five in terms of number of projects categorized and ranked in the top 11 in terms of average cost per project. FHWA has also identified intersections as one of three focus areas for the Focused Approach to Safety effort.
For the Intersection geometry category, most projects are sub categorized as "Intersection geometrics – other/unknown" (45 percent; 204 of 458 projects), "Auxiliary lanes – add left-turn lane" (31 percent; 141 of 458 projects), and "Auxiliary lanes – other" (11 percent; 49 of 458 projects). Examples of projects in the "Intersection geometrics – other/unknown" subcategory include modify intersection corner radius and general intersection safety improvement projects. The "Intersection geometrics – other/unknown" subcategory is predominately used without any project description, therefore, no other information is available for these projects.
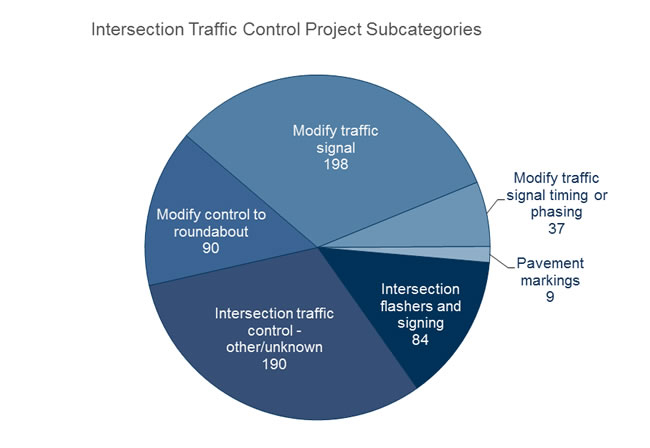
Figure 16: Number of Traffic Control Projects by Subcategory
The Intersection traffic control category was selected for further evaluation because in 2016 (as in previous years) it ranked in the top five in terms of number of projects categorized. FHWA has also identified intersections as one of three focus areas for the Focused Approach to Safety effort.
For the Intersection traffic control category, most projects are subcategorized as "Modify traffic signal" (33 percent; 198 of 608 projects) and "Intersection traffic control – other/unknown" (31 percent; 190 of 608 projects). Examples of projects in the "Intersection traffic control – other/unknown" category include projects described as signal and stop controlled systemic improvements and general intersection traffic control improvement projects. The "Intersection traffic control – other/unknown" subcategory is predominately used without any project description, therefore, no other information is available for these projects. Examples of projects in the "Modify traffic signal" category include modernization/replacement of traffic signal and adding flashing yellow arrow signals.
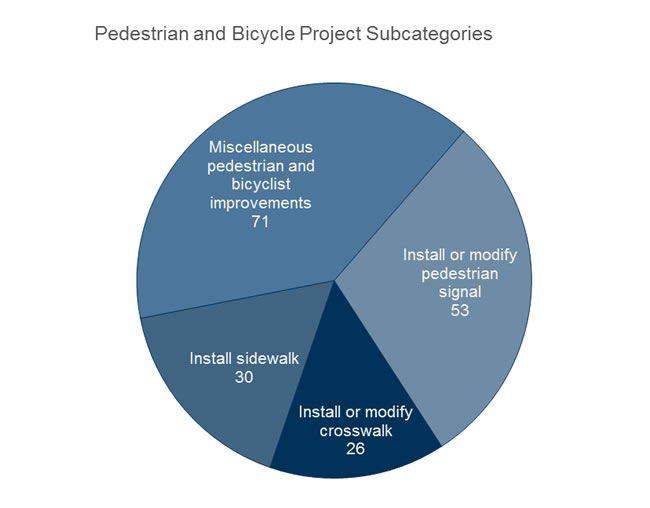
Figure 17: Number of Pedestrian and Bicyclist Projects by Subcategory
The Pedestrian and bicycle category was selected for further evaluation because infrastructure improvements in this category are of significant interest to various stakeholders. FHWA has also identified pedestrians and bicyclists as one of three focus areas under the Focused Approach to Safety effort.
For the Pedestrians and bicyclists category, most projects are subcategorized as "Miscellaneous pedestrian and bicyclist improvements" (39 percent; 71 of 180 projects) and "Install or modify pedestrian signal" (29 percent; 53 of 180 projects). Many of the projects in the "Miscellaneous pedestrian and bicyclist improvements" subcategory do not have any project description, therefore, no other information is available for these projects.
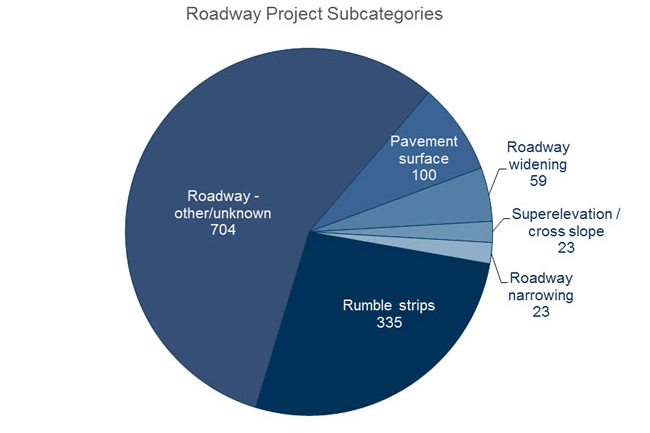
Figure 18: Number of Roadway Projects by Subcategory
The Roadway category was selected for further evaluation because in 2016 (as in previous years) it ranked as the number one category in terms of number of projects categorized. FHWA has also identified roadway departure as one of three focus areas for the Focused Approach to Safety effort.
For the Roadway category, most projects were subcategorized as "Roadway – other/unknown" (57 percent; 704 of 1244 projects) and "Rumble strips" (27 percent; 335 of 1244 projects). Examples of projects in the "Roadway – other/unknown" subcategory were projects such as "restripe to revise separation between opposing lanes and/or shoulder widths".
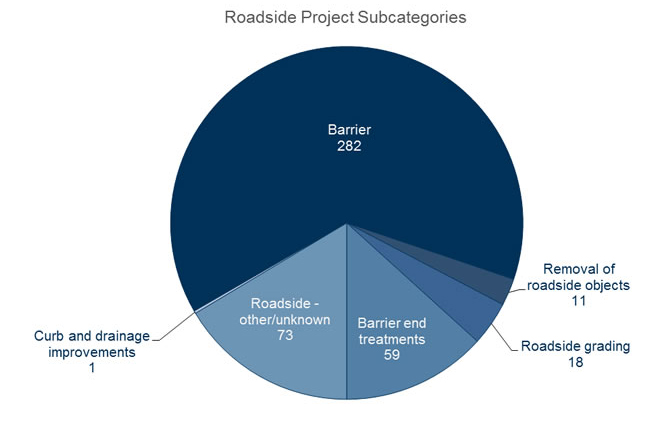
Figure 19 : Number of Roadside Projects by Subcategory
The Roadside category was selected for further evaluation because in 2016 (as in previous years) it ranked in the top five in terms of number of projects categorized and is of national interest lately. For the Roadside category, most projects were subcategorized as "Barrier" (64 percent; 282 of 444 projects), "Roadside – other/unknown" (16 percent; 73 of 444 projects), and "Barrier end treatments" (13 percent; 59 of 444 projects). Examples of two projects in the "Roadside – other/unknown" subcategory were "Barrier – removal" and "Fencing".