SAFETY SOLUTION NEAR SCHOOL IS A ROAD DIET
| Objective | Features | Results |
|---|---|---|
|
|
|


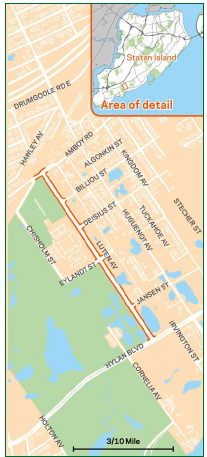
The New York City Department of Transportation (NYCDOT) utilized the Road Diet concept to address safety issues along Luten Avenue in Staten Island by converting a 4-lane roadway to a 2-lane roadway with a center median and parking lanes.
With Luten Avenue running parallel to both Tottenville High School property and Wolfes Pond Park, the area experiences heavy pedestrian activity, especially during school hours and after school activities. The east side of Luten Avenue contains mainly dense vegetation with some access to residential areas.
BACKGROUND
A tragic fatal crash involving a student pedestrian brought the NYCDOT, the Staten Island Community Board 3 (CB3), Tottenville High School, and other community groups together to formulate a plan for implementing safety strategies along Luten Avenue. They needed a treatment to reduce excessive speeds and to provide for safer pedestrian crossings.
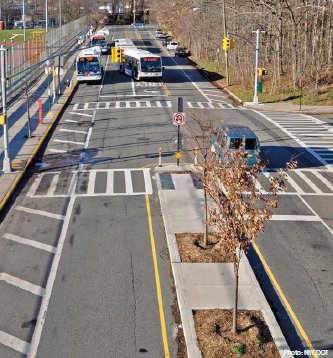
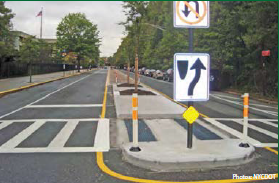
NYCDOT used the information gained from these meetings to develop a proposed Road Diet on Luten Avenue, reducing the through lanes in each direction from two to one. To further narrow the roadway and calm traffic, the project included a painted center median and parking lanes. To address pedestrian safety, the agency installed pedestrian refuge islands and crosswalks. Along with a new signal at the intersection of Deisius Street and Luten Avenue, NYCDOT provided left-turn lanes at intersections along the corridor to improve traffic operations.
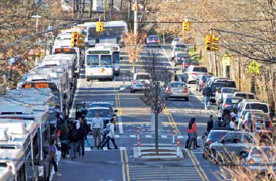
 A Road Diet was installed along Luten Avenue to enhance safety for all road users. |
 A pedestrian refuge island improves safety for pedestrians near Tottenville High School. |
RESULTS
NYCDOT reports that most segments along Luten Avenue have experienced reduced speeds due to the Road Diet, with a marked improvement of the vehicles traveling over the speed limit. The percentage of vehicles exceeding the speed limit decreased by 34 percent along southbound Luten Avenue and decreased by 21 percent in the northbound direction.
Crash data showed the number of crashes involving injuries to motor vehicle occupants and pedestrians after the Road Diet was lower than the average for the 3 years prior to project implementation.
| Before* (3 previous years) | After | |||
|---|---|---|---|---|
| 2007 | 2008 | 2009 | ||
| Total Crashes with Injuries | 6 | 2 | 2 | 2.3 |
| Number of Crashes with Injuries to Motor Vehicle Occupants | 5 | 1 | 0 | 1.7 |
| Number of Crashes with Injuries to Pedestrians | 1 | 1 | 2 | 0.6 |
| * Before columns show the crash history for each of the 3 years immediately prior to project implementation. After column shows number of crashes since implementation (through January 2012) at annual rate. | ||||
Source: New York City DOT, "Sustainable Streets Index 2011." Accessed March 23, 2015. Available at: http://www.nyc.gov/html/dot/downloads/pdf/sustainable_streets_index_11.pdf
