NYCDOT RESPONDS TO TRAGEDY WITH ROAD DIET
| Objective | Features | Results |
|---|---|---|
|
|
|


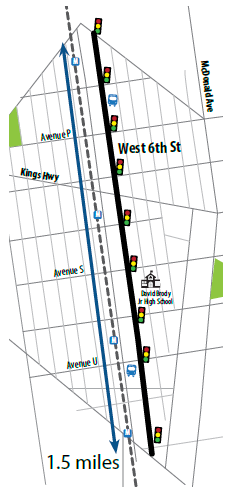
Following three pedestrian fatalities on the same roadway in Brooklyn, the New York City Department of Transportation (NYCDOT) conducted a study of West Sixth Street in November 2009. This 1.5-mile corridor carried fast-moving through traffic along with a high number of pedestrians heading to subway stations in the area. West Sixth Street was a 4-lane undivided arterial with excess capacity, long crossing distances for pedestrians, and significant separation between marked crosswalks, which led to illegal midblock crossings.
Located near residential neighborhoods, West Sixth Street runs parallel to the "N" subway train located one block to the west. There are four subway stops within the project corridor.
 |
 |
Crashes have been reduced and speeds have decreased along West Sixth Street since the Road Diet. |
THE PLAN
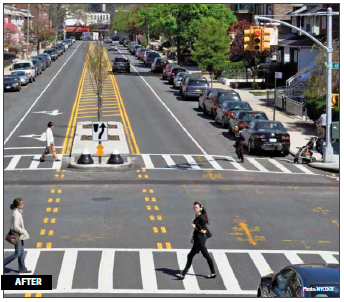
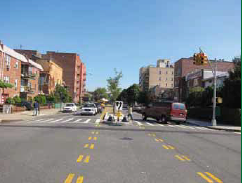
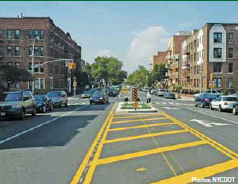
NYCDOT needed a solution to help calm traffic, reduce speeds, and improve pedestrian safety. Since West Sixth Street had excess capacity, NYCDOT adjusted the road to one vehicle lane in each direction and used the extra space to install a wide parking lane and painted median with left-turn bays at key intersections. At the locations with a high frequency of pedestrian crashes, the agency installed pedestrian refuge islands and high visibility crosswalk markings. The design and installation of the pedestrian refuge islands included prohibiting some left turns to reduce conflicts with pedestrians and opposing left turning traffic.
RESULTS
NYCDOT's plan effectively calmed traffic and improved safety along West Sixth Street. The agency analyzed crash data and performed speed studies along the corridor before and after the project was completed, with results indicating improved safety and speed reductions following the Road Diet. Overall average speeds on West Sixth Street decreased by 8 to 12 percent, and the percentage of vehicles exceeding the speed limit showed a reduction of nearly 30 percent in the northbound direction and more than 40 percent in the southbound direction. The before-and-after crash analysis revealed a reduction in the number of injury crashes after installation.
| BEFORE (three previous years) | AFTER | |||
|---|---|---|---|---|
| 2007 | 2008 | 2009 | ||
| Total Crashes with Injuries | 36 | 22 | 27 | 21.5 |
| Number of Crashes with Injuries to: Motor Vehicle Occupants | 15 | 11 | 14 | 8.8 |
| Number of Crashes with Injuries to: Pedestrian | 20 | 10 | 9 | 10.1 |
| Number of Crashes with Injuries to: Bicyclists | 1 | 1 | 4 | 2.5 |
| WEST 6TH STREET (Avenue V to Avenue W) | Average Traffic Speeds (m.p.h.) | Percentage of Vehicles Over the Speed Limit | ||
|---|---|---|---|---|
| BEFORE | AFTER | BEFORE | AFTER* | |
| Northbound | 30.4 | 27.9 | 53% | 34% |
| Southbound | 31.3 | 27.7 | 60% | 18% |
| *After column shows number of crashes since implementation (through Jan 2012) at annual rate. | ||||
Source: New York City DOT, "Sustainable Streets Index 2011." Accessed March 23, 2015. Available at: http://www.nyc.gov/html/dot/downloads/pdf/sustainable_streets_index_11.pdf
