
ROAD DIET IMPROVES PEDESTRIAN SAFETY
| Objective | Features | Results |
|---|---|---|
|
|
|
BACKGROUND
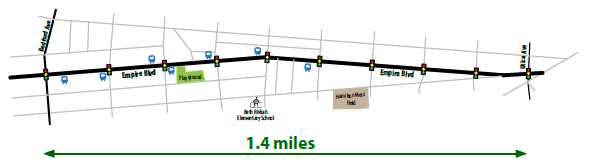
In 2009, the New York City Department of Transportation (NYCDOT) implemented a Road Diet on Empire Boulevard between Utica Avenue and Bedford Avenue. The project aimed to increase pedestrian safety and comfort, calm traffic, and improve the aesthetic appeal of the overall streetscape.
The area surrounding Empire Boulevard is a mix of businesses, restaurants, and single-family and multi-family housing. There is a public school located on the east end of the corridor.
 |
 |
| Road Diet treatment on Empire Boulevard has significantly improved pedestrian safety. | |
SPEEDING AND PEDESTRIAN SAFETY
In 2007, the intersection of Empire Boulevard and Troy Avenue was listed as the second highest pedestrian crash location in New York City. Over the prior 10 years, the corridor had experienced a high proportion of mid-block crashes, including 6 fatalities and 33 serious injuries. NYCDOT found that the 85th percentile speeds during various times of day often exceeded the 30 mph statutory speed limit by 5-10 mph.
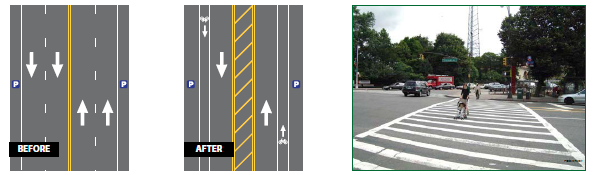
With data to support speeding and pedestrian safety concerns, NYCDOT sought changes for Empire Boulevard. The agency determined the existing 4-lane cross section was unnecessary for handling the traffic volumes occurring on Empire Boulevard. Since excessive capacity often encourages higher speeds, NYCDOT reduced the roadway cross section to two lanes (one in each direction) and allocated the extra space for bicycle lanes.
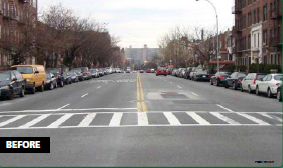
Under existing conditions, the length of the pedestrian crossing on Empire Boulevard was approximately 60 feet, with no raised medians to shelter pedestrians. The Road Diet plan included pedestrian refuge islands and shorter crossing paths. NYCDOT also added turn bays at intersections, preserved the parking spaces along Empire Boulevard, and improved the streetscape with trees and landscaping.
RESULTS
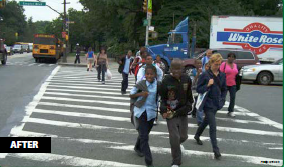
NYCDOT's Road Diet project improved safety for nearly all users. Pedestrian injuries decreased by 19 percent and overall crash injuries reduced by 27 percent. The area also experienced noticeable reductions in motor vehicle crashes and total crashes. Ultimately, the new layout improved both bicycle and pedestrian accessibility and comfort by reducing vehicle speeds and incorporating bicycle and pedestrian safety features into the streetscape.
| Before | After | Change | ||||||||
|---|---|---|---|---|---|---|---|---|---|---|
| ‘06 – ’07 | ‘07 – ’08 | ‘08 – ’09 | Average | ‘09 – ’10 | ‘10 – ’11 | ‘11 – ’12 | Average | Actual | Percent | |
| Total Crashes | 268 | 297 | 301 | 288.7 | 284 | 251 | 252 | 262.3 | -26.3 | -9% |
| Injuries | 88 | 77 | 74 | 79.7 | 73 | 62 | 67 | 67.3 | -12.3 | -15% |
| Motor Vehicle Occupant | 109 | 119 | 81 | 103.0 | 61 | 71 | 68 | 66.7 | -36.3 | -35% |
| Pedestrian | 35 | 29 | 19 | 27.7 | 28 | 21 | 18 | 22.3 | -5.3 | -19% |
| Cyclist | 4 | 5 | 3 | 4.0 | 10 | 8 | 10 | 9.3 | 5.3 | 133% |
| TOTAL INJURIES | 148 | 153 | 103 | 134.7 | 99 | 100 | 93 | 98.3 | -36.3 | -27% |
| Each before year is the 12-month period beginning June 1 and ending May 31. The 3-year after period is Sept. 1, 2009 to August 31, 2012. The implementation period of June 1, 2009 to August 31, 2009 is excluded. Source: NYPD AIS/TAMS Crash Database. | ||||||||||