A FEASIBILITY EVALUATION USING TRAFFIC SIMULATION SOFTWARE
| Objective | Features | Results |
|---|---|---|
|
|
|
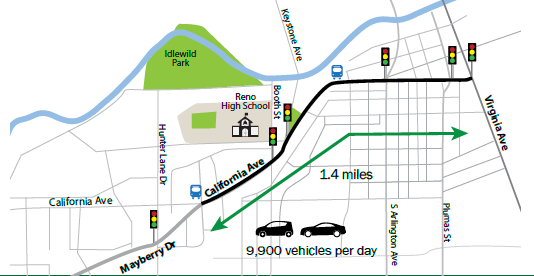
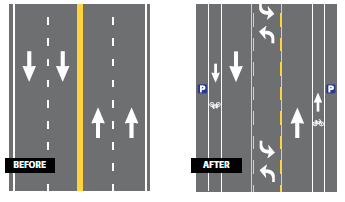
The Regional Transportation Commission (RTC) of Washoe County installed a Road Diet on California Avenue between Mayberry Drive and South Virginia Street in Reno, Nevada. To evaluate the feasibility of completing the Road Diet and to evaluate its impact on the existing traffic flow, the RTC used traffic simulation software.


RESEARCH PLAN
Researchers collected 24-hour directional volume counts and spot speed data at three locations along California Avenue. Additionally, turning movement counts were manually collected at all intersections along the study corridor in order to collect baseline levels of service at each intersection. The researchers utilized simulation software to mimic the intended roadway configuration after the Road Diet and its effect on traffic. Future traffic growth was not considered in the analysis in order to have a direct one-to- one comparison of before-and-after level of service outcomes.
PROCEDURE
Researchers followed a four-step process for completing the Road Diet simulation.
1. Collection of traffic counts
The research team collected one week of 24-hour directional traffic volume counts using tube-counters at three locations along the proposed segment.
2. Collection of speed data
The research team collected spot speed data at the same three locations as the traffic counts. The team determined the 50th and 85th percentile speeds as inputs to the simulation data.
3. Collection of turning movement data at signalized intersections
Researchers obtained manual turning movement counts during morning and evening peak hours at intersections along the proposed segment. This data was used to determine the level of service (LOS) of the intersections before the Road Diet conversion.
4. Simulation analysis
Researchers simulated the Road Diet conditions at two combined intersections and at the access points. For the purpose of the simulation, the access points were treated as two-way stop-controlled intersections.
RESULTS
The intersections experienced unchanged LOS or dropped by one LOS category (e.g., from LOS B to C). The outcome of the simulation indicated that none of the intersections dropped below LOS D.
| Intersection | a.m. peak hour | p.m. peak hour | ||||||
|---|---|---|---|---|---|---|---|---|
| Existing | Future | Existing | Future | |||||
| LOS | V/C | LOS | V/C | LOS | V/C | LOS | V/C | |
| Booth St. | B | 0.77 | C | 0.84 | B | 0.30 | C | 0.43 |
| Keystone Ave. | B | 0.76 | C | 0.88 | B | 0.53 | C | 0.69 |
| S. Arlington Ave/ Clay St. | B | 0.11 | C | 0.13 | C | 0.53 | D | 0.87 |
| S. Sierra St. | A | 0.49 | A | 0.58 | A | 0.58 | B | 0.73 |
| S. Virginia St. | A | 0.37 | A | 0.37 | B | 0.43 | B | 0.43 |
Overall, the results showed that implementation of a Road Diet along this section of road would likely reduce the overall LOS, but only to a level still deemed acceptable by the RTC of Washoe County. Based on this finding, the RTC concluded that the traffic simulation analysis provided enough support to proceed with the Road Diet, and it was implemented in 2010.
Source: Li, H. and Tian, Z., "Feasibility Evaluation of Road Diet Projects – A Case Study in Reno, NV" Accessed March 17, 2015. Available at: http://www.westernite.org/annualmeetings/sanfran10/Papers/Poster%20Papers/ITE%20Paper_Poster-Li.pdf
