
Under the HSIP MAP-21 reporting guidance, each project should be assigned a general improvement category and a subcategory under that general category. While a single project may consist of multiple project types, FHWA directs States to assign each project to only one category. The category chosen should align with the primary purpose of the project. Figure 8 and Figure 9 show the distribution of the number of projects by general improvement category. Figure 10 and Figure 11 combined show the distribution of the total cost of projects by general improvement category. Projects categorized as "Unknown" indicate that there was no general improvement category assigned by the State. Figure 12 through Figure 16 show the breakdown of the number of projects by subcategory for five improvement categories: Intersection geometry, Intersection traffic control, Pedestrians and bicyclists, Roadway, and Non-infrastructure. More detailed tables with the cost spent in each subcategory are available in Appendix B. For ease of reporting, similar subcategories were grouped together. For example, in Figure 12 below, "Auxiliary lanes – other" combines adding acceleration lanes, adding auxiliary through lanes, adding two way left turn lanes, and several other related subcategories.
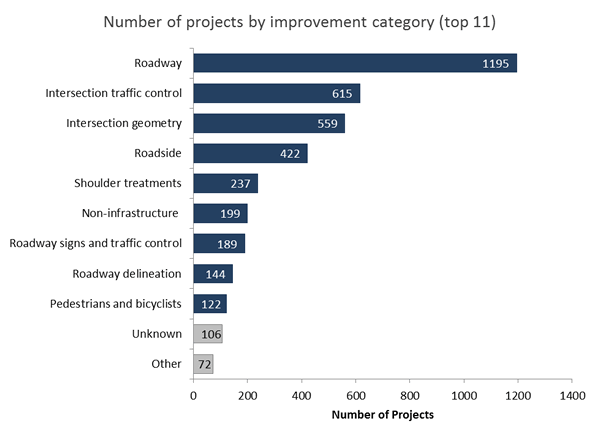
Figure 8. Number of Projects by Improvement Category (Top 11)
Figure 8 shows the number of projects by improvement category (top 11) as classified in the HSIP MAP-21 Reporting Guidance. Based on the project information reported by the States, the top five improvement categories are roadway, intersection traffic control, intersection geometry, roadside, and shoulder treatments. In 2013 and 2014, the top five improvement categories were the same and the numbers of projects classified in each category were similar with the exception of the roadway category. In 2015, there were approximately 475 additional projects classified in the roadway category. The ranking of the remaining project categories was similar in all three years.
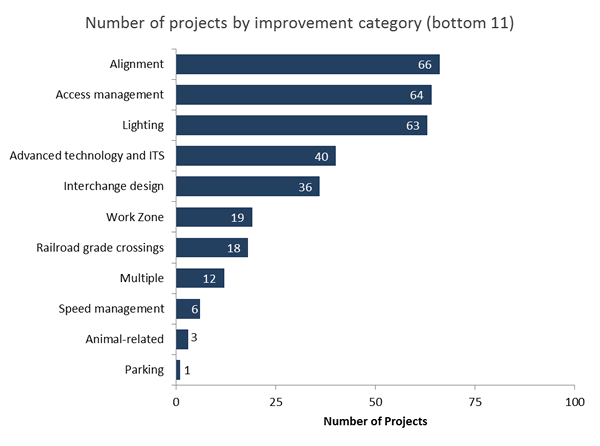
Figure 9. Number of Projects by Improvement Category (Bottom 11)
Figure 9 shows the number of projects by improvement category (bottom 11) as classified in the HSIP MAP-21 Reporting Guidance. In 2014, the number and ranking of projects classified in each category for the bottom 11 were similar.
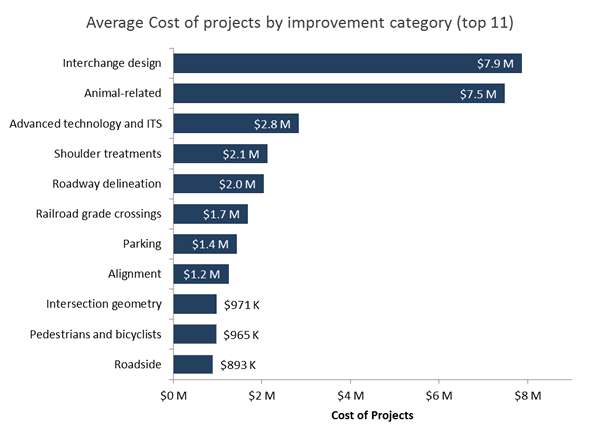
Figure 10. Average Total Cost of Projects by Improvement Category (top 11)
Figure 10 shows the average total cost of projects by improvement category (top 11). Again, it is important to note that not every project had an associated cost so the average is based on the number of projects with cost available. Compared to 2014, the following categories had notable differences in average project costs. Note that the "Multiple" category indicates that a State selected more than one improvement category. For example, the project could include changes to lighting, signs, pavement markings, intersection geometry, and number of lanes.
- Lighting – moved from the top 11 in 2014 to the bottom 11 in 2015 (decreased from $1.2M in 2014 to $527K in 2015)
- Multiple – moved from the top 11 in 2014 to the bottom 11 in 2015 (decreased from $1.2M in 2014 to $190K in 2015)
- Animal-related – remained in the top 11 for 2015 (increased from $1.6M in 2014 to $7.5M in 2015)
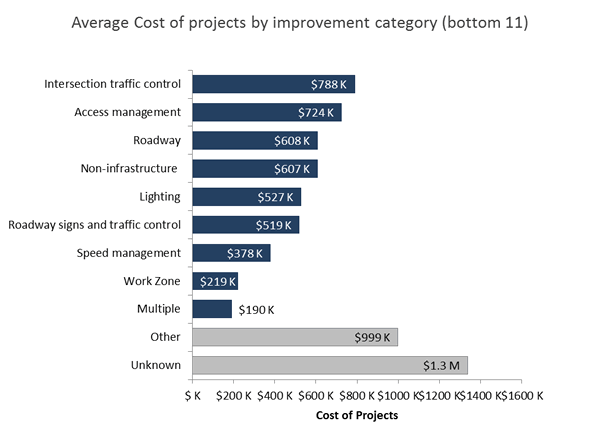
Figure 11. Average Total Cost of Projects by Improvement Category (bottom 11)
Based on project information reported by the States, the lowest average HSIP cost projects are in the following categories:
- Lighting; 61 projects with cost information
- Roadway signs and traffic control; 171 projects with cost information
- Speed management; 4 projects with cost information
- Work zone; 19 projects with cost information
- Multiple; 12 projects with cost information
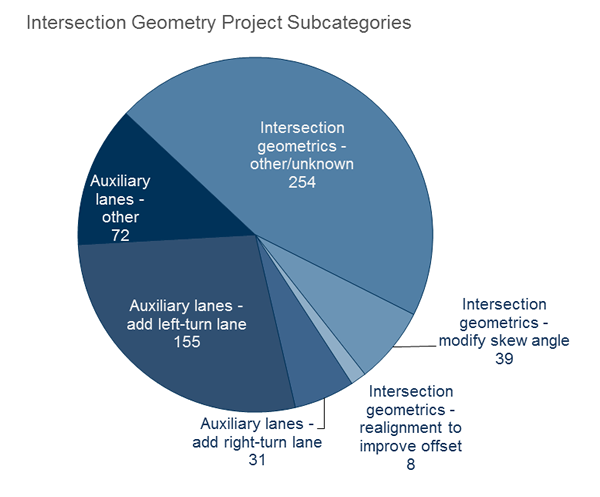
Figure 12. Number of Intersection Geometry Projects by Subcategory
The Intersection geometry category was selected for further evaluation because in 2015 (as in previous years) it ranked in the top five in terms of number of projects categorized and ranked in the bottom 11 in terms of average cost per project. FHWA has also identified intersections as one of three focus areas for the Focused Approach to Safety effort.
For the Intersection geometry category, most projects are sub categorized as "Intersection geometrics – other/unknown" (45 percent; 254 of 559 projects), "Auxiliary lanes – add left-turn lane" (28 percent; 155 of 559 projects), and "Auxiliary lanes – other" (13 percent; 72 of 559 projects). Examples of projects in the "Intersection geometrics – other/unknown" subcategory include modify intersection corner radius and general intersection safety improvement projects. The "Intersection geometrics – other/unknown" subcategory is predominately used without any project description, therefore, no other information is available for these projects.
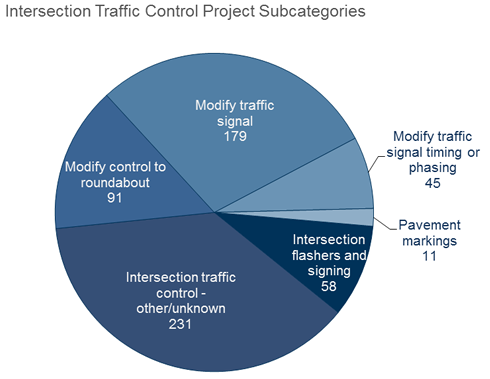
Figure 13. Number of Traffic Control Projects by Subcategory
The Intersection traffic control category was selected for further evaluation because in 2015 (as in previous years) it ranked in the top five in terms of number of projects categorized. FHWA has also identified intersections as one of three focus areas for the Focused Approach to Safety effort.
For the Intersection traffic control category, most projects are subcategorized as "Intersection traffic control – other/unknown" (38 percent; 231 of 615 projects) and "Modify traffic signal" (29 percent; 179 of 615 projects). Examples of projects in the "Intersection traffic control – other/unknown" category include projects described as signal and stop controlled systemic improvements and general intersection traffic control improvement projects. The "Intersection traffic control – other/unknown" subcategory is predominately used without any project description, therefore, no other information is available for these projects. Examples of projects in the "Modify traffic signal" category include modernization/replacement of traffic signal and adding flashing yellow arrow signals.
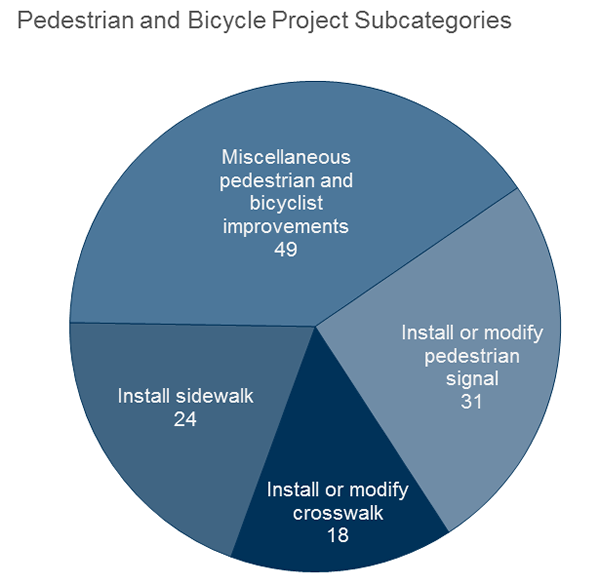
Figure 14. Number of Pedestrian and Bicyclist Projects by Subcategory
The Pedestrian and bicycle category was selected for further evaluation because infrastructure improvements in this category are of significant interest to various stakeholders. FHWA has also identified pedestrians and bicyclists as one of three focus areas under the Focused Approach to Safety effort.
For the Pedestrians and bicyclists category, most projects are subcategorized as "Miscellaneous pedestrian and bicyclist improvements" (40 percent; 49 of 122 projects) and "Install or modify pedestrian signal" (25 percent; 31 of 122 projects). Many of the projects in the "Miscellaneous pedestrian and bicyclist improvements" subcategory do not have any project description, therefore, no other information is available for these projects.
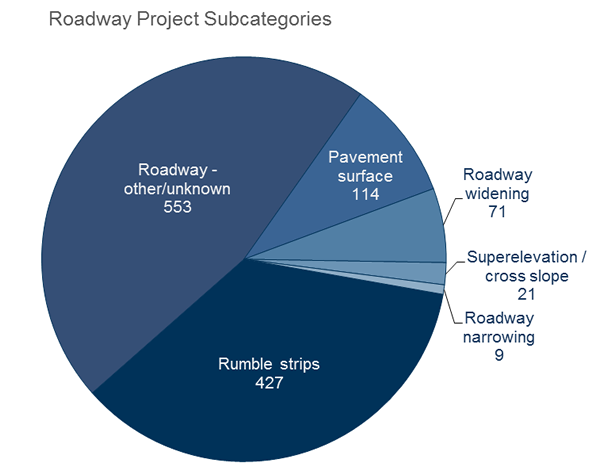
Figure 15. Number of Roadway Projects by Subcategory
The Roadway category was selected for further evaluation because in 2015 (as in previous years) it ranked as the number one category in terms of number of projects categorized. FHWA has also identified roadway departure as one of three focus areas for the Focused Approach to Safety effort.
For the Roadway category, most projects were subcategorized as "Roadway – other/unknown" (46 percent; 553 of 1195 projects) and "Rumble strips" (36 percent; 427 of 1195 projects). Examples of projects in the "Roadway – other/unknown" subcategory were projects such as "restripe to revise separation between opposing lanes and/or shoulder widths".
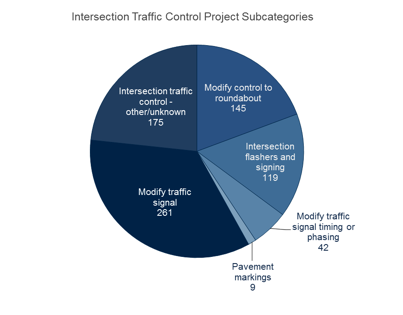
Figure 16. Number of Non-Infrastructure Projects by Subcategory
The Non-infrastructure category was selected for further evaluation because improvements in this category are of significant interest to various stakeholders. For the Non-infrastructure category, most projects were subcategorized as "Data/traffic records" (30 percent; 59 of 199 projects), "Transportation safety planning" (22 percent; 44 of 199 projects), "Educational efforts/outreach" (17 percent; 33 of 199 projects), and "Road safety audits" (15 percent; 29 of 199 projects).