
Under the HSIP MAP-21 reporting guidance, each project should be assigned a general improvement category and a subcategory under that general category. While a single project may consist of multiple project types, FHWA directs States to assign each project to only one category. The category chosen should align with the primary purpose of the project. Figure 8 and Figure 9 show the distribution of the number of projects by general improvement category. Figure 10 and Figure 11 combined show the distribution of the total cost of projects by general improvement category. Projects categorized as "Unknown" indicate that there was no general improvement category assigned by the State. Figure 12 through Figure 16 show the breakdown of the number of projects by subcategory for five improvement categories: Intersection geometry, Intersection traffic control, Pedestrians and bicyclists, Roadway, and Non-infrastructure. More detailed tables with the cost spent in each subcategory are available in Appendix B. For ease of reporting, similar sub categories were grouped together. For example, in Figure 12 below, "Auxiliary lanes – other" combines adding acceleration lanes, adding auxiliary through lanes, adding two way left turn lanes, and several other related subcategories.
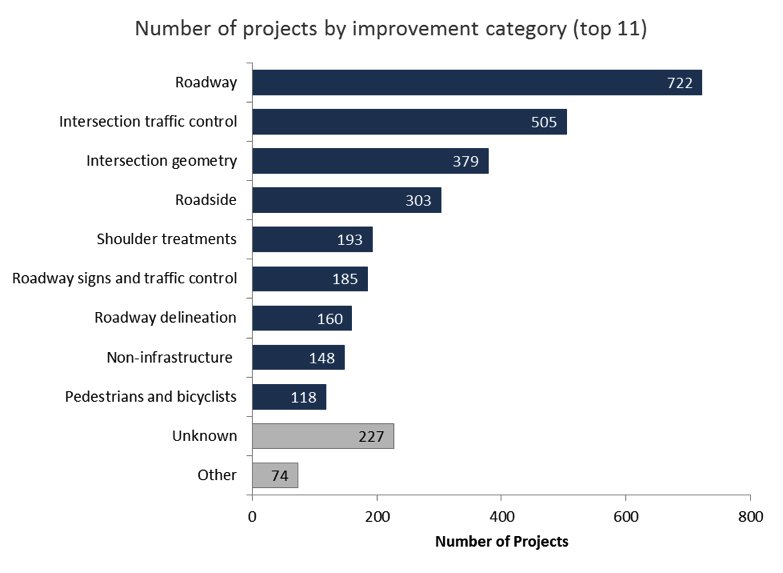
Figure 8. Number of Projects by Improvement Category (Top 11)
Figure 8 shows the number of projects by improvement category (top 11) as classified in the HSIP MAP-21 Reporting Guidance. Based on the project information reported by the States, the top five improvement categories are roadway, intersection traffic control, intersection geometry, roadside, and shoulder treatments. In 2013, the top five improvement categories were the same and the number of projects classified in each were similar.
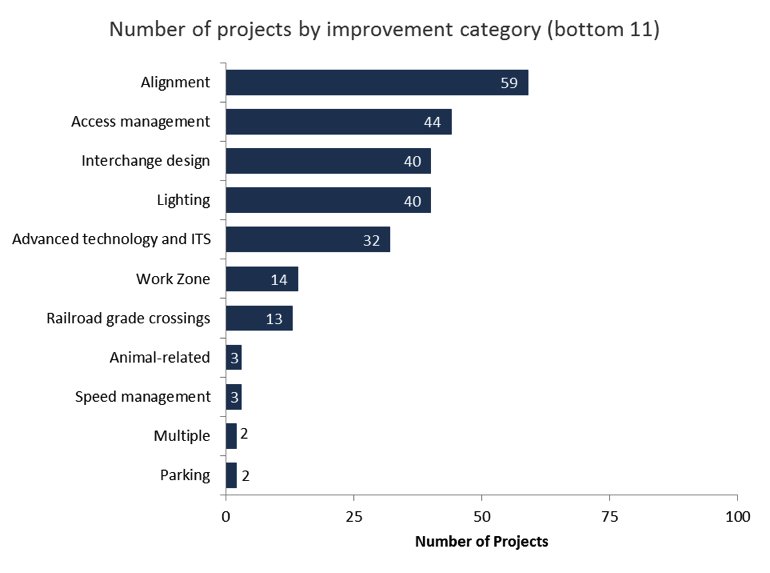
Figure 9. Number of Projects by Improvement Category (Bottom 11)
Figure 9 shows the number of projects by improvement category (bottom 11) as classified in the HSIP MAP-21 Reporting Guidance. In 2014, there were half as many projects categorized as "Interchange design" as in 2013. Also in 2014, there were 14 projects categorized as "Work zone" compared to just one project in 2013. The ranking of the remaining project categories was similar in both years.
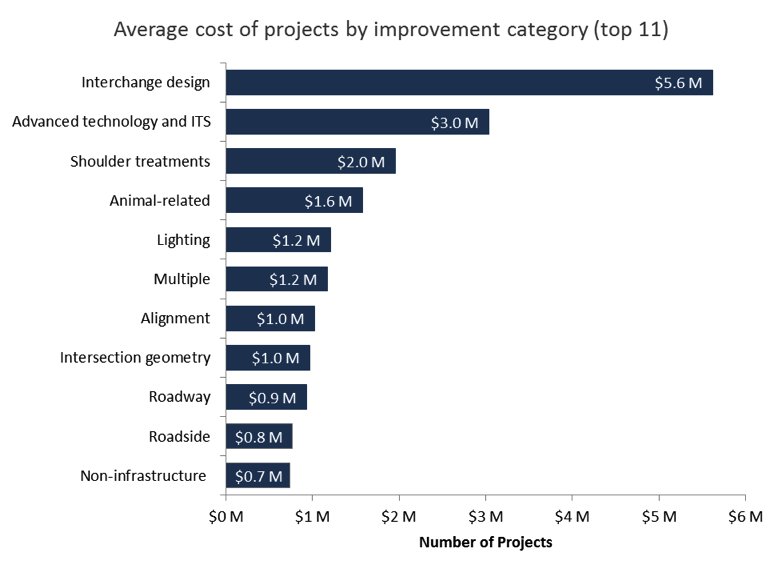
Figure 10. Average Total Cost of Projects by Improvement Category (top 11)
Figure 10 shows the average total cost of projects by improvement category (top 11). Again, it is important to note that not every project had an associated cost so the average is based on the number of projects with cost available.
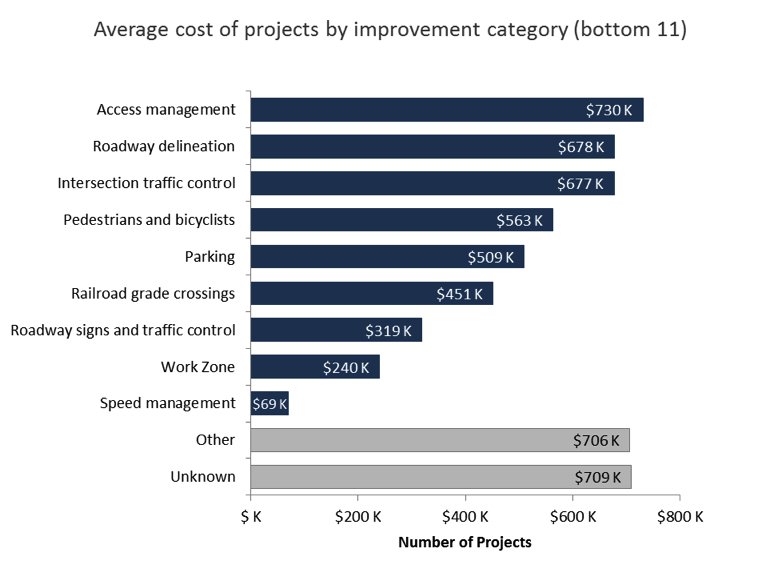
Figure 11. Average Total Cost of Projects by Improvement Category (bottom 11)
Based on project information reported by the States, the lowest average HSIP cost projects are in the following categories:
- Speed management; 3 projects with HSIP cost information
- Work zone; 14 projects with HSIP cost information
- Roadway signs and traffic control; 185 projects with HSIP cost information
- Railroad grade crossings; 13 projects with HSIP cost information
- Parking; 2 projects with HSIP cost information
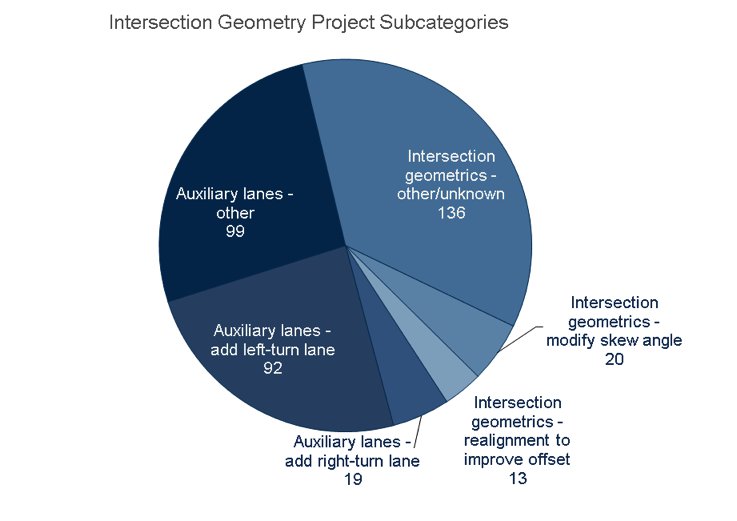
Figure 12: Number of Intersection Geometry Projects by Subcategory
For the Intersection geometry category, most projects were sub categorized as "Intersection geometrics – other/unknown" (136 of 379 projects), "Auxiliary lanes – other" (99 of 379 projects), and "Auxiliary lanes – add left-turn lane" (92 of 379 projects). Examples of projects in the "Intersection geometrics – other/unknown" subcategory include widen/resurface to construct J turns and general intersection safety improvement projects. The "Intersection geometrics – other/unknown" subcategory was predominately used without any project description, therefore, no other information is available for these projects.
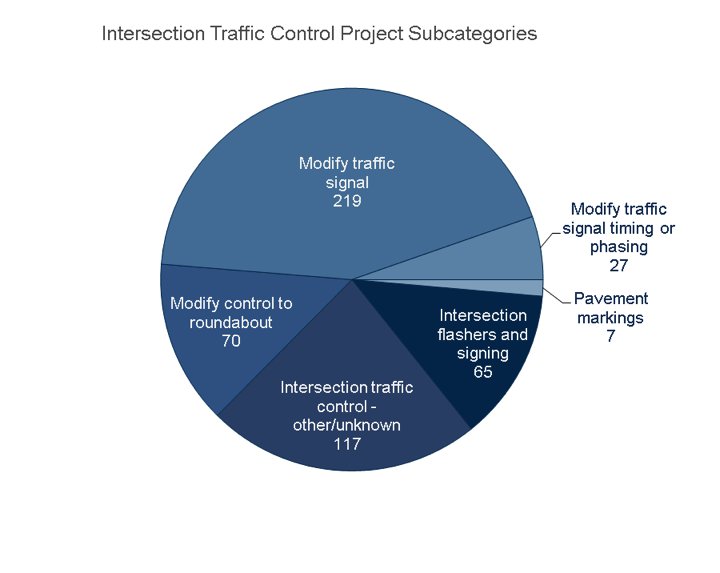
Figure 13: Number of Traffic Control Projects by Subcategory
For the Intersection traffic control category, most projects were subcategorized as "Modify traffic signal" (219 of 505 projects) which includes signal replacement/modernization, addition of new signals, flashing yellow arrow, and vehicle preemption. Examples of projects in the "Intersection traffic control – other/unknown" sub category include projects described as general intersection safety improvement projects. The "Intersection traffic control – other/unknown" subcategory was predominately used without any project description, therefore, no other information is available for these projects.
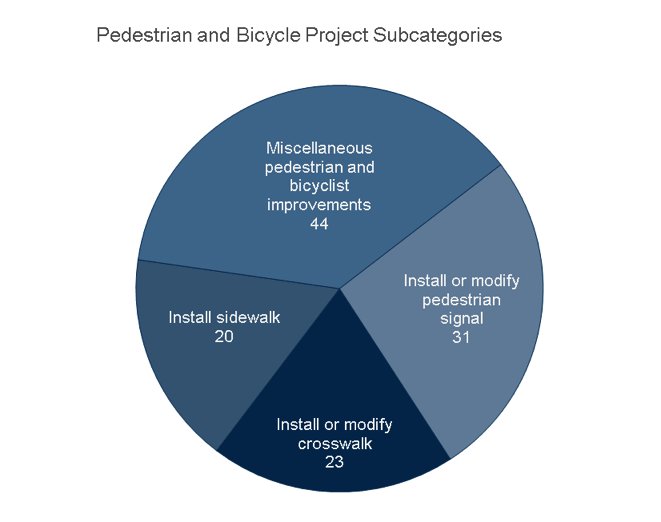
Figure 14: Number of Pedestrian and Bicyclist Projects by Subcategory
For the Pedestrians and bicyclists category, most projects were subcategorized as "Miscellaneous pedestrian and bicyclist improvements" (44 of 118 projects) and "Install or modify pedestrian signal" (31 of 188 projects). Many of the projects in the "Miscellaneous pedestrian and bicyclist improvements" subcategory are Safe Routes to School activities.
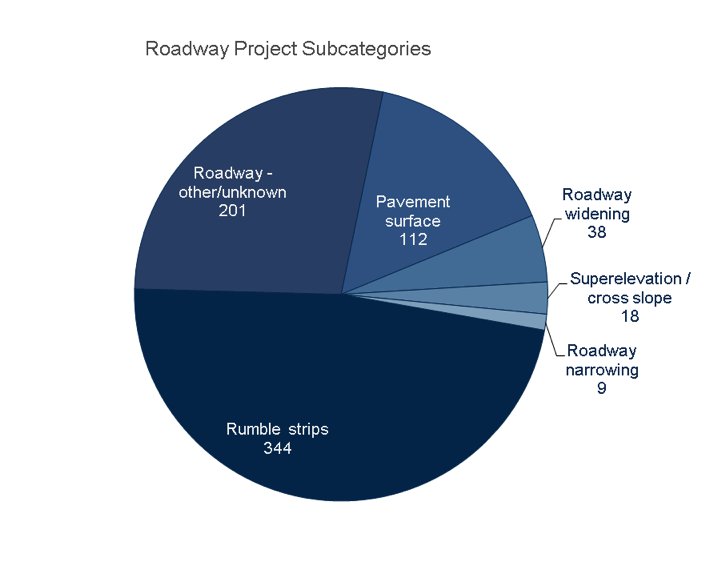
Figure 15: Number of Roadway Projects by Subcategory
For the Roadway category, most projects were subcategorized as "Rumble strips" (344 of 722 projects) and "Roadway – other/unknown" (201 of 722 projects). Examples of projects in the "Roadway – other/unknown" subcategory were combinations projects such as "repair pavement structure, replace guardrail, and pavement markers" and "sight distance-superelevation-shoulder widening".
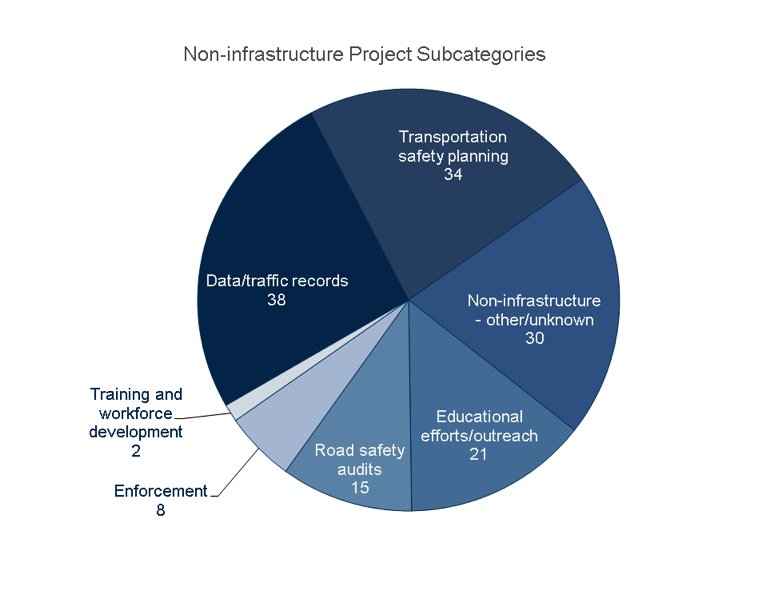
Figure 16: Number of Non-Infrastructure Projects by Subcategory
For the Non-infrastructure category, most projects were subcategorized as "Data/traffic records" (38 of 148 projects), "Transportation safety planning" (34 of 148 projects), and "Non-infrastructure – other/unknown" (30 of 148 projects). Projects in the "Non-infrastructure – other/unknown" subcategory are largely undescribed. A few examples include calibrating state specific Highway Safety Manual safety performance functions, development of statewide safety planning tools, and development of HSIP/safety operations manuals.