States provide project specific information for all projects obligated with HSIP funds during the state-defined reporting period in their annual HSIP reports. An obligation is a commitment – the Federal Government's promise to pay the States for the Federal Share of a project's eligible cost. The reporting period is defined by the State and can be calendar year, state fiscal year or federal fiscal year.
As per the HSIP Reporting Guidance, project specific information includes:
- Improvement Category (see Appendix A for complete descriptions)
- Project output (e.g., miles of rumble strips)
- Project cost
- Relationship to the State's strategic highway safety plan (SHSP) (i.e. emphasis area, strategy)
Limited analysis of the project information can be done because not all states have submitted reports in accordance with the HSIP Reporting Guidance. Full use of the HSIP online reporting tool and compliance with the most recent HSIP reporting guidance will enable more complete and accurate reporting of national HSIP project data. In addition, HSIP projects come in all shapes and sizes. For example, some HSIP projects may be much bigger in scope than others, countermeasure installations across multiple sites, or non-infrastructure projects (i.e. transportation safety planning, data improvements).
Based on the information contained in the 2009-2012 HSIP reports and summarized in Table 2 below, States obligated $6.5B of HSIP funds for more than 9,000 projects over the four-year period. These obligations include not only HSIP funds apportioned during the reporting period (2009-2012), but also HSIP funds available from previous years' apportionments. The average cost per project across all years isnearly $750,000 per project.
Table 2: Total Number and Cost of Projects by Year
| Year | 2009 | 2010 | 2011 | 2012 | Total |
|---|---|---|---|---|---|
| Number of Projects | 1684 | 2386 | 2523 | 2429 | 9022 |
| Number of Projects (with cost info.) | 1609 | 2348 | 2449 | 2374 | 8780 |
| Cost of projects | $1.61B | $1.46B | $1.77B | $1.65B | $6.50B |
| Avg. Cost Per Project | $1.00M | $620,684 | $725,550 | $695,721 | $740,287 |
Note: Not all states provided cost data for all projects
A further disaggregation of the HSIP project data from 2009 to 2012 is provided in Appendix B (Number of Projects by Improvement Category) and Appendix C (Cost of Projects by Improvement Category). Figures 1 and 2 present this data and summarize the number and cost, respectively, of highway safety improvement projects by improvement category between 2009 and 2012. The improvement categories are consistent with example highway safety improvement projects included in 23 U.S.C. 148, 23 CFR 924 and the HSIP Reporting Guidance. The improvement categories related to railway-highway crossings include those projects obligated using HSIP funds. The HSIP National Summary Baseline Report does not include projects obligated with Railway-Highway Crossing Program funds available under 23 U.S.C. 130.
Please note that multiple improvement categories may apply to each project; however, improvement categories are selected based on the primary purpose of the project. For example, the State recently completed a pavement overlay at intersection A to improve the skid resistance on the approaches to the intersection. This project could be categorized as (1) intersection safety improvement, (4) installation of skid resistant surface and (11) improvement of highway signage and pavement markings. The State chose improvement category (4) installation of skid resistant surface since that was the primary purpose of the project.
For the number of projects per improvement category for all years (2009-2012), four out of five of the top improvement categories (Appendix B) used by the states were:
- (1) An intersection safety improvement project
- (2) Pavement and shoulder widening
- (11) Improvement of highway signage and pavement markings
- (17) Installation of guardrails, barriers (including barriers between construction work zones and traffic lanes for the safety of road user and workers), and crash attenuators
The remaining top improvement category for 2009 was "(23) Other", for 2010 and 2011 "(3) Installation of rumble strips or other warning devices", and 2012 "(13) Installation of a traffic control or other warning device at a location with high crash potential".
Figure 1: Number of projects per improvement category (2009-2012)
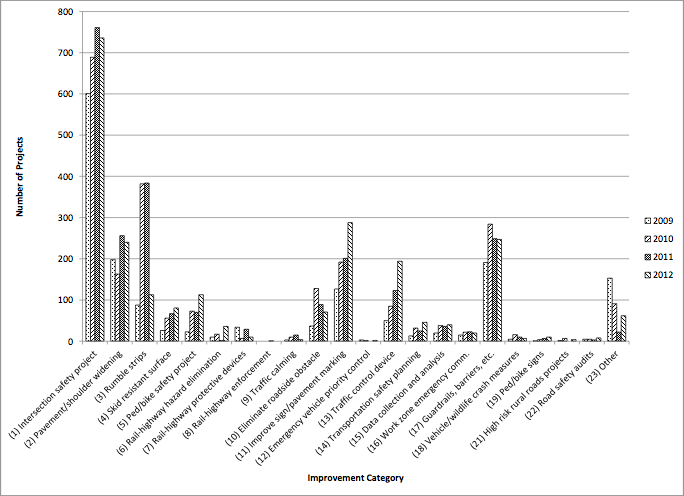
Figure 2: Cost of project (millions) per improvement category (2009-2012)
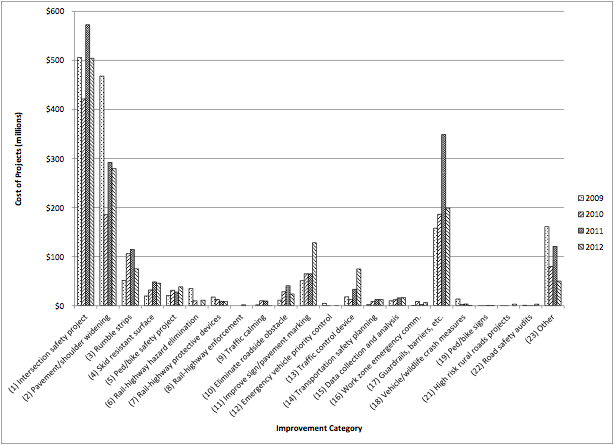
For the cost of projects per improvement category for all years (2009-2012), four out of five of the improvement categories (Appendix C) for which states obligated the most HSIP funds were:
- (1) An intersection safety improvement project
- (2) Pavement and shoulder widening
- (3) Installation of rumble strips or other warning devices
- (17) Installation of guardrails, barriers (including barriers between construction work zones and traffic lanes for the safety of road user and workers), and crash attenuators
The remaining top improvement category for 2009-2011 was "(23) Other and 2012 "(11) Improvement of highway signage and pavement markings". The total cost of projects for all improvement categories has fluctuated each year with 2011 as the highest.
Table 3 shows the average cost per project by improvement category as well as the percentage of projects in each improvement category that reported cost. This percentage was calculated by dividing the total number of projects with cost information by the total number of projects with improvement category information. For example, in 2009 there were 601 projects categorized as (1) intersection safety project but only 572 of these projects had cost information. Therefore, the percentage of projects reporting cost is 95 percent. It is also important to reiterate that HSIP projects come in all shapes and sizes and that some may be much bigger in scope than others. These points might partly explain some of the variation in average cost across years, as shown in Table 3, below. Based on the cost of projects reported by the States, the lowest average cost projects are in the following categories:
- (19) Installation and maintenance of signs (including fluorescent yellow-green signs) at pedestrian-bicycle crossings and in school zones.
- (16) Planning integrated interoperable emergency communications equipment, operational activities or traffic enforcement activities (including law enforcement assistance) relating to work zone safety.
- (22) Conducting road safety audits
- (13) Installation of a traffic control or other warning device at a location with high crash potential
- (14) Transportation safety planning
Table 3: Average Cost per Project and Percentage of Cost Reported by Improvement Category
| Improvement Category | 2009 Average Cost | 2009 % | 2010 Average Cost | 2010 % | 2011 Average Cost | 2011 % | 2012 Average Cost | 2012 % | Average Cost (all years) |
|---|---|---|---|---|---|---|---|---|---|
| (1) Intersection safety project | 95 | $627,896.59 | 97 | $768,401.82 | 98 | $692,653.61 | 99 | $737,805.14 | $884,351.35 |
| (2) Pavement/shoulder widening | 98 | $1,138,180.29 | 100 | $1,159,550.56 | 98 | $1,164,369.39 | 100 | $1,442,992.48 | $2,411,968.24 |
| (3) Rumble strips | 100 | $277,678.38 | 100 | $299,008.89 | 100 | $665,821.28 | 100 | $360,032.39 | $591,147.28 |
| (4) Skid resistant surface | 96 | $646,000.78 | 89 | $726,957.43 | 100 | $600,117.95 | 95 | $672,593.71 | $803,310.16 |
| (5) Ped/bike safety project | 100 | $460,968.26 | 95 | $407,154.96 | 99 | $363,937.87 | 94 | $448,518.98 | $925,071.78 |
| (6) Rail-highway hazard elimination | 100 | $597,711.76 | 100 | $144,863.00 | 100 | $318,095.06 | 100 | $877,734.37 | $3,515,048.60 |
| (7) Rail-highway protective devices | 100 | $1,899,480.00 | 100 | $318,804.93 | 100 | $918,084.20 | 100 | $619,303.66 | $524,169.06 |
| (8) Rail-highway enforcement | n/a | n/a | n/a | $2,000,000.00 | 100 | n/a | n/a | $2,000,000.00 | n/a |
| (9) Traffic calming | 100 | $1,021,726.20 | 100 | $656,738.53 | 100 | $92,366.50 | 100 | $700,701.28 | $661,545.00 |
| (10) Eliminate roadside obstacle | 97 | $223,563.56 | 100 | $464,126.14 | 99 | $343,520.54 | 99 | $325,909.21 | $317,696.97 |
| (11) Improve sign/pavement marking | 99 | $343,196.73 | 99 | $323,510.58 | 100 | $473,370.42 | 94 | $392,900.46 | $405,469.61 |
| (12) Emergency vehicle priority control | 67 | $37,401.50 | 100 | n/a | n/a | $114,300.00 | 100 | $852,022.67 | $2,404,366.50 |
| (13) Traffic control device | 88 | $153,491.01 | 99 | $273,956.79 | 100 | $401,091.28 | 96 | $319,119.79 | $413,192.47 |
| (14) Transportation safety planning | 100 | $272,905.69 | 100 | $508,930.60 | 100 | $278,791.33 | 100 | $320,730.81 | $224,932.77 |
| (15) Data collection and analysis | 100 | $327,867.32 | 100 | $444,720.22 | 100 | $420,979.56 | 100 | $413,804.31 | $507,085.50 |
| (16) Work zone emergency comm. | 100 | $405,435.05 | 100 | $103,276.52 | 100 | $322,515.40 | 100 | $231,477.99 | $51,533.33 |
| (17) Guardrails, barriers, etc. | 100 | $666,369.41 | 99 | $1,401,261.02 | 100 | $819,354.02 | 98 | $927,128.74 | $828,400.60 |
| (18) Vehicle/wildlife crash measures | 100 | $154,303.94 | 100 | $361,946.52 | 100 | $145,896.63 | 100 | $556,220.75 | $2,805,356.80 |
| (19) Ped/bike signs | 100 | $147,516.25 | 100 | $137,096.86 | 100 | $86,986.50 | 100 | $111,000.91 | $22,412.00 |
| (21) High risk rural roads projects | 100 | $56,435.71 | 100 | n/a | n/a | $837,257.25 | 100 | $323,829.23 | $232,850.50 |
| (22) Road safety audits | 100 | $94,483.40 | 100 | $127,296.67 | 100 | $438,298.13 | 100 | $271,421.62 | $267,832.40 |
| (23) Other | 88 | $901,484.33 | 98 | $6,257,329.70 | 100 | $1,283,747.02 | 92 | $1,362,477.90 | $1,192,624.47 |
Note: Not all states provided cost data for all projects in a given improvement category. Therefore, the columns labeled as "%" are a calculation of the total number of projects that reported cost divided by the total number of projects in each improvement category.
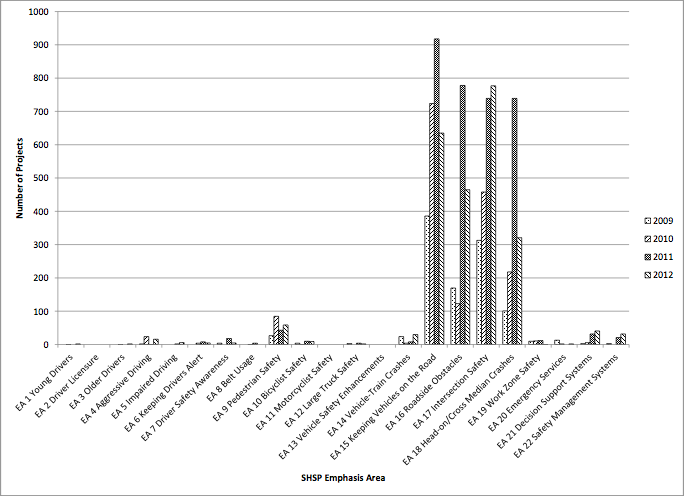
Table 4 and Figure 3 present the number of HSIP projects categorized by SHSP emphasis area between 2009 and 2012. For consistency and national reporting purposes, each State's SHSP emphasis areas were assigned to the AASHTO SHSP emphasis areas. A complete description of each emphasis area is included in Appendix D. Please note that States often times categorize a single project by several SHSP Emphasis Areas. Therefore, for the purpose of Table 4 and Figure 3, a single project may be counted more than once. For example, the State recently completed an intersection improvement project that enhanced safety for pedestrians. This project could be categorized as EA 9 Making Walking and Street Crossing Safer as well as EA 17 Improving the Design and Operation of Intersections and is therefore counted once in each category.
For the number of projects per SHSP Emphasis Area for all years (2009-2012), the top five SHSP Emphasis Areas guiding HSIP investments are:
- EA 15 Keeping Vehicles on the Roadway
- EA 17 Improving the Design and Operation of Intersections
- EA 16 Minimizing the Consequences of Leaving the Roadway
- EA 18 Reducing Head-on and Cross Median Crashes
- EA 9 Making Walking and Street Crossing Safer
Table 4: Number of HSIP Projects by SHSP Emphasis Area per Year
| SHSP Emphasis Area | 2009 | 2010 | 2011 | 2012 | Total |
|---|---|---|---|---|---|
| EA 1 Young Drivers | 0 | 1 | 0 | 2 | 3 |
| EA 2 Driver Licensure | 0 | 0 | 0 | 0 | 0 |
| EA 3 Older Drivers | 0 | 1 | 0 | 2 | 3 |
| EA 4 Aggressive Driving | 2 | 24 | 1 | 16 | 43 |
| EA 5 Impaired Driving | 0 | 0 | 2 | 6 | 8 |
| EA 6 Keeping Drivers Alert | 0 | 4 | 8 | 5 | 17 |
| EA 7 Driver Safety Awareness | 4 | 0 | 18 | 5 | 27 |
| EA 8 Belt Usage | 0 | 1 | 4 | 0 | 5 |
| EA 9 Pedestrian Safety | 27 | 85 | 43 | 59 | 214 |
| EA 10 Bicyclist Safety | 4 | 1 | 10 | 9 | 24 |
| EA 11 Motorcyclist Safety | 0 | 0 | 0 | 0 | 0 |
| EA 12 Large Truck Safety | 3 | 0 | 4 | 2 | 9 |
| EA 13 Vehicle Safety Enhancements | 0 | 0 | 0 | 0 | 0 |
| EA 14 Vehicle-Train Crashes | 24 | 4 | 8 | 30 | 66 |
| EA 15 Keeping Vehicles on the Road | 386 | 724 | 918 | 635 | 2,663 |
| EA 16 Roadside Obstacles | 170 | 123 | 778 | 465 | 1,536 |
| EA 17 Intersection Safety | 313 | 458 | 739 | 777 | 2,287 |
| EA 18 Head-on/Cross Median Crashes | 101 | 218 | 739 | 321 | 1,379 |
| EA 19 Work Zone Safety | 10 | 11 | 12 | 1 | 34 |
| EA 20 Emergency Services | 13 | 2 | 0 | 2 | 17 |
| EA 21 Decision Support Systems | 3 | 6 | 32 | 41 | 82 |
| EA 22 Safety Management Systems | 3 | 0 | 21 | 32 | 56 |
Figure 3: Number of HSIP projects per SHSP emphasis area