A number of technical and engineering techniques are closely associated with traffic speeds. The designed driving environment consists primarily of infrastructure and traffic control devices. The geometric design process is used to define the location and dimensions of road and street infrastructure which consists of the horizontal and vertical alignment, cross section features, intersection type and all the associated details. Traffic control devices are used to regulate, warn and guide drivers through the use of signs, traffic signals, pavement markings and other devices.
Geometric design is an engineering discipline that attempts to account for interactions between drivers, infrastructure and vehicles. The techniques and criteria reflect both theoretical and practical considerations and evolve as new reliable research conclusions are reached. This section of the guide introduces and summarizes several technical topics and techniques that are closely related to speed.
DESIGN SPEED
The design speed is a selected speed used to determine the various geometric design features of the roadway (1). The historical evolution of the design speed definition has been well documented in NCHRP Report 504 (5). The design speed concept was first proposed in 1936 as "the maximum reasonably uniform speed which would be adopted by the faster driving group of vehicle operations, once clear of urban areas (6)." The American Association of State Highway Officials (AASHO) accepted a modified definition of design speed in 1938 as "the maximum approximately uniform speed which probably will be adopted by the faster group of drivers, but not, necessarily, by the small percentage of reckless ones (7)." Beginning with the 1954 version of A Policy on Geometric Design of Rural Highways, the definition of the design speed was "the maximum safe speed that can be maintained over a specified section of highway when conditions are so favorable that the design features of the highway govern. (8)." Inclusion of the "maximum safe speed" was included in the design speed definition until release of the 2001 version of the AASHTO Green Book. Removal of "the maximum safe speed" from the design speed definition was proposed in 1997 as a result of NCHRP Report 400 (9). It was recognized that operating speeds can be greater than the design speed, and the term safe was removed to avoid the perception that speeds greater than the design speed were "unsafe" (5). The revised definition as a result of NCHRP Report 400 is the definition that is presented at the beginning of this section, and is the definition used today. For the purposes of this informational guide, the design speed concept described in this section is referred to as the "designated design speed." The designated design speed is used explicitly for determining minimum values for highway design such as horizontal curve radius and sight distance. The designated design speed is typically included within design documentation and is often shown on the cover sheet of design plans.
A second design speed term is also used in this informational guide. It is referred to as the "inferred design speed." Inferred design speed is applicable only to features and elements that have a criterion based on (designated) design speed (e.g., vertical curvature, sight distance, superelevation). The inferred design speed of a feature will be different than the designated design speed when the actual value is different than the criterion-limiting (minimum or maximum) value. The inferred design speed for a radius-superelevation combination is the maximum speed for which the limiting speed-based side friction value is not exceeded for the designed rate of superelevation and the inferred design speed (determined through an iterative process). The inferred design speed for a horizontal curve may also be limited by horizontal offsets to sight obstructions on the inside of a horizontal curve. The inferred design speed for a crest vertical curve is the maximum speed for which the available stopping sight distance is not exceeded by the required stopping sight distance. The inferred design speed may also be limited by a combination of lane width and average daily traffic. The inferred design speed can be greater than, equal to, or less than the designated design speed.
SIGHT DISTANCE
To maintain vehicle paths and avoid conflicts, drivers need visibility of road and traffic conditions. Drivers continuously and (after a certain level of driving experience is gained) subconsciously process visual information through observation, interpretation and responsive action. Visibility needs are related to the operating environment and vehicle speeds. These are the key factors used in developing geometric criteria for sight distance. The Green Book identifies four types of sight distance: decision, intersection, passing (on two-lane roads) and stopping and provides guidance on where each type is recommended. The Green Book establishes minimum design values for sight distance and above minimum values are encouraged where feasible. As a result, the inferred design speed resulting from the highway geometric design process (i.e., actual roadway geometry that is constructed) is often higher than the designated design speed.
The methods of determining the criterion for a particular situation are also included in the Green Book and are related to speed. A set of assumptions, usually based on research or practical experience, are incorporated into the criteria. One of the key assumptions relates to the object or condition that should be seen. In the case of passing sight distance, the object is a vehicle approaching the passing vehicle in the same lane and opposite direction. The assumption is that the approaching vehicle is a passenger car and the object is assumed to be 3.5 feet above the pavement elevation. This is one of many assumptions used to formulate the relationship between speed and passing sight distance criteria.
Stopping sight distance should be provided along the entire length of every road and street. In that sense, it is the most common type of sight distance. The first and second columns in table 2 indicate the relationship between design speed and the Green Book stopping sight distance criteria on relatively level roadways. The criteria assume a driver perception-reaction time of 2.5 seconds, driver eye height of 3.5 feet and an object height (i.e., tail lights of another vehicle) of 2.0 feet. The assumptions for driver eye height and tail light height reflect the 5th percentile statistics (9). This means that 95 percent of vehicles have a driver eye height and tail light height greater than these values. The assumed perception-reaction time exceeds the 90th percentile driver reaction time. However, normal perception-reaction times vary from about 0.75 to 1.5 seconds (10) depending on the alertness, fatigue level, alcohol consumption, and age of the driver.
Table 2. Comparison of stopping sight distance requirements for various conditions.
|
Design speed (mph) |
AASHTO design stopping sight distance criteria (feet) |
Estimated stopping sight distance for mean driver |
Estimated stopping sight distance for dry roadway conditions |
|
15 |
80 |
40 |
75 |
|
20 |
115 |
60 |
110 |
|
25 |
155 |
80 |
150 |
|
30 |
200 |
105 |
190 |
|
35 |
250 |
135 |
235 |
|
40 |
305 |
165 |
285 |
|
45 |
360 |
200 |
340 |
|
50 |
425 |
235 |
400 |
|
55 |
495 |
275 |
465 |
|
60 |
570 |
320 |
535 |
|
65 |
645 |
365 |
605 |
|
70 |
730 |
415 |
680 |
|
75 |
820 |
465 |
765 |
|
80 |
910 |
520 |
850 |
Another assumption used in developing Green Book stopping sight distance criteria is that braking will result in a vehicle deceleration rate of 11.2 feet/second2 [0.35g]. This deceleration rate was developed through research in consideration of developments in vehicle technologies and driver performance. It also assumes that the friction provided by the driving surface is adequate to support this rate. Some vehicles with good tires on good pavement can brake at 0.85g or higher with most able to brake in emergency stops at 0.7g or better. Although most pavements provide adequate friction for the assumed deceleration rate, inclement weather conditions (e.g., snow and ice) may not. On wet pavement, most vehicles can stop at 0.4g or higher even with bald tires. The deceleration rate on ice [0.15g] and snow [0.22g] are lower (11). It has also been shown that heavy vehicles achieve the same deceleration rate as passenger cars on wet pavement when the heavy vehicle is equipped with antilock brakes (12). Since the AASHTO design criteria accounts for wet pavement and allows for controlled braking, it has been shown that the design stopping sight distance criteria are adequate for heavy vehicles.
In addition to the Green Book stopping sight distance design criteria shown in table 2, the third column is the estimated stopping sight distance based on the mean driver with a reaction time of 1.1 seconds and a vehicle deceleration rate of 17.71 ft/sec2 (9). This is intended to show how large the difference in required stopping sight distance is between the average driver and the design or 90th percentile driver. The final column in table 2 also shows the stopping sight distance required for the 90th percentile driver on dry roadway conditions. The design criteria assume that the available friction is that of a wet roadway. The difference between estimated wet and dry stopping sight distance is not based upon available friction, but drivers’ tendency to decelerate at a higher rate on dry pavement conditions. However, in an emergency stop, the difference between wet and dry stopping distance is due to friction.
Sight distance requirements also depend on the vertical alignment (or profile) of the roadway. On inclines (upgrades), the effect of gravity is to reduce vehicle speeds. Conversely, a vehicle descending a grade is being accelerated by gravity. For steep grades, uphill or down, gravity has a real and practical effect on the stopping sight distance. Generally, no adjustment to the base condition (level road) criteria is made for small grades (less than three percent), positive or negative.
VERTICAL CURVATURE
Vertical curves are used to transition from one grade (i.e., slope in the direction of travel) to another. Figure 1 illustrates two types of vertical curves, crest and sag.

The rate of change in grades affects both driver comfort and sight distance. Crest vertical curves can limit sight distance by restricting a driver’s line of sight, as shown in figure 2. In figure 2, the point of vertical curve (beginning point of curve), point of vertical intersection (intersection of initial and final grades), and point of vertical tangent (end point of curve) are shown as PVC, PVI, and PVT, respectively. The initial and final grades are G1 and G2, respectively. The unobstructed horizontal distance between the driver eye height (H1) and object height above the roadway surface (H2) defines the available stopping sight distance.
Sag vertical curves affect how headlight beams intersect the roadway and reveal an object as shown in figure 3. If a vertical curve is long enough to provide adequate sight distance, it will also provide adequate driver comfort.


Minimum rates of vertical curvature (K) are included in the Green Book for different categories of sight distance, design speed and vertical curve type (i.e., crest, sag). The minimum length of vertical curve can be determined by using these rates and equation 1, shown below.

HORIZONTAL CURVATURE AND SUPERELEVATION
Road and street alignments are comprised of two basic elements, curves and tangents. The most common type of horizontal alignment curve, and the only one discussed here, is the simple curve which has a single (constant) radius. Tangents are straight sections between curves.
The forces associated with vehicles and occupants moving along a curved path are more complicated than for a straight path. A vehicle and its contents (hereafter simplified to "vehicle") traversing a curved roadway at a constant speed are accelerating toward the center of the curve. This is known as centripetal acceleration. The magnitude of the acceleration is a function of the vehicle speed and radius of curvature.
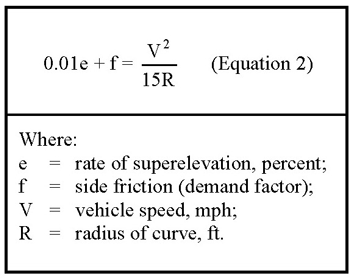
A vehicle can only follow a circular roadway alignment if a centripetal force (Fc) is applied. The direction of this force is the same as the acceleration, toward the center of the curve. With some simplifying assumptions, equation 2 can be derived. The left side of the equation represents two external forces and the right side is the resulting acceleration.

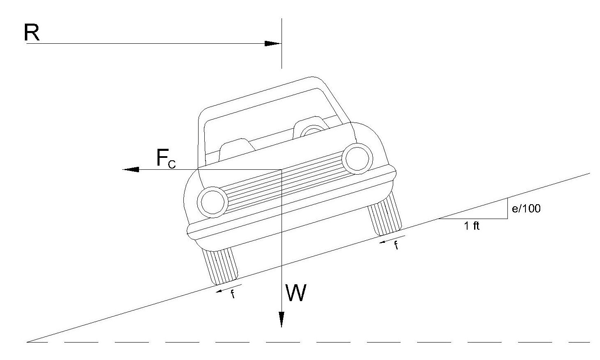
The two left-hand side components represent superelevation and friction. Superelevation is another term for "banking" the roadway. As shown in figure 4, superelevation results in part of the vehicle’s mass being accelerated laterally, toward the low side of the banked section (the vehicle’s weight, W, is shown in Figure 4). Higher rates of superelevation increase the lateral acceleration provided by this component.

It should be noted that superelevation and friction are "signed." They have magnitude and direction. Friction and superelevation do not necessarily act in the same direction. For purposes of this discussion, the positive direction is defined as toward the center of the curve. Negative superelevation is actually quite common. Think of a road with a normal crown (i.e., high point in center and sloping outward in both directions). If the normal crown is maintained through a curve, both sides have superelevation but with opposite signs. For a curve to the left, the right lane of a normal crown section has negative superelevation.
Friction usually, but not always, acts toward the center of the curve which has been defined as the positive direction. Exceptions occur, such as a vehicle traveling at low speed along a road with a high rate of superelevation. Once a road is constructed, the radius and superelevation (both direction and magnitude) are known and constant. The required side friction will vary with speed.
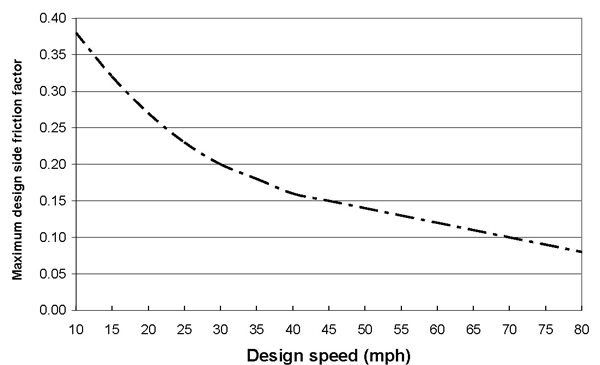
Drivers and other vehicle occupants moving on a turning roadway "feel" the side friction developed between the tire and pavement. It is often referred to as unbalanced lateral acceleration and is a direct indication of driver discomfort. A passenger (or driver) traveling along a curve at 70 mph will be less comfortable than one traversing the same curve at 55 mph. The use of friction factors in geometric design, particularly limiting or maximum values, is often misunderstood. Design criteria for horizontal curves (minimum radii, design rate of superelevation) are established so that maximum design side friction factors are not exceeded at the design speed. Maximum design side friction factors decrease with design speed. Values used in the 2004 Green Book are shown in figure 5. The values are established so that the friction required to maintain a vehicle’s path along the curved alignment will nearly always be achievable. Maximum design side friction factors are not determined solely as a matter of physics or engineering mechanics. Turning maneuvers become more demanding for drivers as the unbalanced lateral acceleration (side friction) increases. In recognition of this, human factors come into play in establishing maximum design side friction factors.
The term "comfort" is used to describe the human response to different levels of unbalanced lateral acceleration. The maximum design side friction factors were set so that unbalanced lateral acceleration levels do not cause discomfort to vehicle occupants. The values currently in use are based on research of passenger comfort (blindfolded passengers) conducted in the 1940s. Subsequent advancements in vehicle technologies call into question the validity of the historic research and its continued use for design and analysis purposes. This leads to two important conclusions. First, the maximum design side friction factors do not represent the limit of available friction based strictly on material properties and mechanics. Second, the research on human response to unbalanced lateral acceleration (i.e., demand friction) is dated and may no longer apply.
Observed speeds on horizontal curves routinely exceed designated design speeds. The maximum design side friction factors in use adequately accommodate the design speed under a wide range of conditions (i.e., related to tire, pavement and driver variability), including very poor conditions. Therefore, higher curve speeds can be attained under good conditions, and even average conditions. This condition is so prevalent that design values are suspected of being unrealistic or inappropriate.

Source: Ref (1)
