HORIZONTAL CURVATURE
Given:
Designated Design Speed = 60 mph
Radius = 716.20 ft
Superelevation Rate = 6.6 %
e(max) = 8 %
Determine the inferred design speed based on Green Book criterion for horizontal curvature based on a method 2 distribution. The method 2 distribution assumes that all lateral acceleration is first used by the friction and the rest is distributed to the superelevation rate using the following equation:
where:
e = rate of superelevation, percent;
f = side friction (demand factor);
V = vehicle speed, mph;
R = radius of curve, ft.
Rearranging the equation to solve for the inferred design speed yields:
An iterative process is used to determine the inferred design speed using the maximum friction values, maximum superelevation, and design speed from Exhibit 3-15 of the Green Book (1).
Since the maximum superelevation is not used, it is obvious that a radius that exceeds the calculated minimum will be necessary. Thus, beginning with the existing radius, existing superelevation, and a design speed of 50 mph, determine if the maximum friction of 0.14 is exceeded as follow.
f = 0.1667, which exceeds the maximum friction value of 0.14.
The next iteration is to try a 49 mph design speed with a maximum friction value of 0.142
f = 0.157, which exceeds the maximum friction value of 0.142
The next iteration is to try a 48 mph design speed with a maximum friction value of 0.144
f = 0.148, which exceeds the maximum friction value of 0.144
The next iteration is try a 47 mph design speed with a maximum friction value of 0.146
f = 0.140, which does not exceed the maximum friction value of 0.146
From this point, it can be stated that the maximum one mile-per-hour increment of speed that the existing features meet is a 47 mph design speed. Therefore, the inferred design speed for this horizontal curve is 47 mph.
An assumption that is used in this calculation is that available friction for design speed values is linear between speed increments. This assumption is true for design speeds that meet and exceed 40 mph.
VERTICAL CURVATURE
Method 1
Given:
A crest vertical curve has the following attributes:
g1 = +2.6%
g2 = -3.5%
Length = 800 ft
Determine the inferred design speed based on Green Book stopping sight distance criterion for a vehicle traveling from left to right.
Using terminology and criteria in the 2004 Green Book, the following are determined:
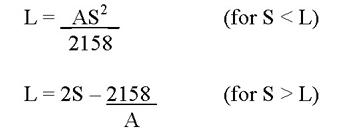
Using the Green Book recommended values for driver eye height and object height and a given L (vertical curve length) and A (algebraic difference in grades), the reduced form equations below are used to determine S (sight distance):
The first equation controls (S < L) and S = 532 ft.
The minimum stopping sight distance criteria are provided in the Green Book for design speeds in 5 mph increments. The value of 532 ft falls between the values associated with 55 mph (495 ft) and 60 mph (570 ft). The highest even 5-mph increment for which stopping sight distance is met is 55 mph. Interpolating leads to an estimate of 57.5 mph. A more precise estimate can be obtained by using the basic sight distance formula (2004 Green Book Equation 3-2) to compute the corresponding speed. This approach yields an estimate of 57.7 mph. Grades can also affect stopping distance but no adjustment is appropriate in this case. Keeping in mind the various assumptions and approximations, an estimate rounded to the nearest one mph is recommended, 58 mph in this example.
Method 2
The inferred design speed can also be calculated for vertical curves if the available sight distance is known. The available sight distance can be measured through field surveys, as-built plan and profile sheets, and through existing software packages such as IHSDM.
The following equation can be used to determine the inferred design speed with the available sight distance being known:
where:
SSD = Available stopping sight distance
V = Design speed (or inferred design speed)
t = perception-reaction time (assumed to be 2.5 seconds)
a = deceleration rate (assumed to be 11.2 ft/sec2)
Given:
Crest vertical curve
Minimum SSD = 485 ft
Having put the stopping sight distance equation into a spreadsheet file, the required stopping sight distance for 0.5 mph increments can be shown as follows.
|
Speed (mph) |
Stopping Sight Distance (ft) |
|
45 |
359.739 |
|
45.5 |
365.920 |
|
46 |
372.148 |
|
46.5 |
378.425 |
|
47 |
384.750 |
|
47.5 |
391.122 |
|
48 |
397.543 |
|
48.5 |
404.011 |
|
49 |
410.528 |
|
49.5 |
417.093 |
|
50 |
423.705 |
|
50.5 |
430.366 |
|
51 |
437.075 |
|
51.5 |
443.831 |
|
52 |
450.636 |
|
52.5 |
457.488 |
|
53 |
464.389 |
|
53.5 |
471.337 |
|
54 |
478.334 |
|
54.5 |
485.378 |
|
55 |
492.471 |
|
55.5 |
499.611 |
|
56 |
506.800 |
|
56.5 |
514.036 |
|
57 |
521.321 |
|
57.5 |
528.653 |
|
58 |
536.034 |
|
58.5 |
543.462 |
|
59 |
550.939 |
|
59.5 |
558.463 |
|
60 |
566.036 |
As can be seen from this table, the available stopping sight distance does not quite meet the requirements for a 54.5 mph design speed. Rounding to the nearest mph, the inferred design speed for this curve is 54 mph.
This same method can be applied to horizontal curves that have a sight obstruction on the inside of the curve. When the available sight distance is calculated or found from field survey, the same equation can be applied for determining the inferred design speed.


