
The first objective of this project was to develop a conceptual model of a MIRE MIS. This section provides a broad overview of the conceptual model including the potential business functions and methodologies an agency would need to undertake in order to implement a MIRE MIS. The research team predominantly based the design of the MIRE MIS on the MIRE data inventory published in 2010 (1). Ideally, agencies will integrate MIRE MIS with other roadway- related and supplemental databases that a State needs for safety analyses. Most State DOTs have not achieved this level of integration. As more DOTs adopt geographic information systems (GIS) for their network base mapping, integration of various types of safety data will continue and improve.
MIRE MIS involves the integration of several safety-related databases.
MIRE MIS ENVIRONMENT
The MIRE MIS is designed as a relational database that States can map using their current GIS capabilities. The design of the MIRE MIS allows a State flexibility in obtaining its MIRE data elements, whether the State stores its existing systems in Oracle or another relational database, or whether the State imports/exports data elements from legacy systems. Once the State adds data elements to the MIRE MIS, they should already be familiar with processes used in State or Federal safety and spatial analysis tools.
MIRE MIS DATA FLOW DIAGRAM
Several States distribute the responsibility for various aspects of roadway-related data across departments. For example, the planning department is typically responsible for establishing the network based on original plans, change orders, and as-built plans. Once the department completes a roadway project and opens it to the public, the data for that roadway become available within the roadway database. At that time, other units and departments are responsible for collecting, correcting, and updating specific data elements within the roadway inventory database pertaining to that location. Figure 2 illustrates this flow of roadway data types in the MIRE MIS data flow diagram (DFD).
The DFD is a graphical representation of the flow of data through an information system. The DFD shows how a system is divided into smaller portions, and highlights the flow of data between those parts. The programmer can expand the context-level, or overview, DFD to show more details of the system as it is modeled. As the programmer adds more details to the model, the DFD allows users to visualize how the system will operate, what the system will accomplish, and how the system will be implemented. Appendix A contains the key describing the components of a DFD.
The DFD illustrated in Figure 2 shows the concept of the MIRE MIS as a decision support system that is available for safety-related reporting and analysis. It depicts the interaction and relationships between various inventories and processes.
MIRE MIS will use the various roadway-related databases that DOTs currently have. The DFD illustrates, for example, that the user will import roadway segment data from the existing roadway inventory database, bridge data elements from the bridge inspection and appraisal database, crash data elements from the crash database, and so forth. By establishing the MIRE MIS in this manner, reporting and analysis activities will not interfere with operational uses of the existing roadway-related databases.

Figure 2. MIRE MIS Data Flow Diagram (see Appendix A for legend).
MIRE MIS DATA COLLECTION PROCESS
The research team evaluated data collection methods to document assets that can be included in a MIRE MIS. Examples of data collection methods include using an instrumented van, conducting a field survey, examining photogrammetry or aerial photography, and use of light detection and ranging (LIDAR) measurements. The report from that study, MIRE Element Collection Mechanisms and Gap Analysis, documents more specific information about the data collection process (7). The project team also conducted a pilot data collection effort through the Lead Agency Program. A report documenting that effort will be available as well. An additional outcome of this project is the MIRE Guidebook which provides guidance on how to collect MIRE data elements. All of these documents will be available online at the FHWA website http://safety.fhwa.dot.gov/rsdp/.
MODEL MIRE MIS
Entity Relationship Modeling is a technique used to analyze and model data using an Entity Relationship Diagram (ERD). There are two primary types of models discussed in this document: a conceptual model and a logical model. A conceptual model provides a quick, global reference of data structures. A logical model is a translation of the conceptual model into structures that can be implemented using a database management system (DBMS). Figure 3 is a conceptual model of a potential MIRE MIS illustrated in an ERD. Further description of the logical model is provided in the next section on the development of the MIRE MIS prototype.
An entity is an aggregation of a number of data elements, and an entity type is a class of entities with the same attributes. The ERD illustrates the relationship or association between two or more entities by showing the degrees of relationship (one-to-one, one-to-many, and many-to- many). Defining the degrees of relationship is known as cardinality. For this ERD, crow's foot notation is used to indicate the relationship between entities. The crow's foot indicates that there may be many matches between the two entities (e.g., many segments of roadway have many guardrails). The addition of a circle indicates that not all segments of roadway may have a guardrail on it. The connectors with double bars indicate a one-to-one relationship (e.g., this segment of roadway has one, and only one, pavement type).
The primary key (PK) represents the unique identifier for an entity. In a relational database, the entity is typically represented as a row in a table. The foreign key (FK) represents a reference within one entity (such as a roadway segment) to another entity (such as the State highway to which the segment belongs). Entities with clear backgrounds are the collection of MIRE data elements. The entities shaded in green are the supplemental data types outlined in MIRE Version 1.0 that are useful for safety analysis, but are not included in the specific 202 MIRE data element listing. These are the potential tables that States can define in a relational database for use as the MIRE MIS.
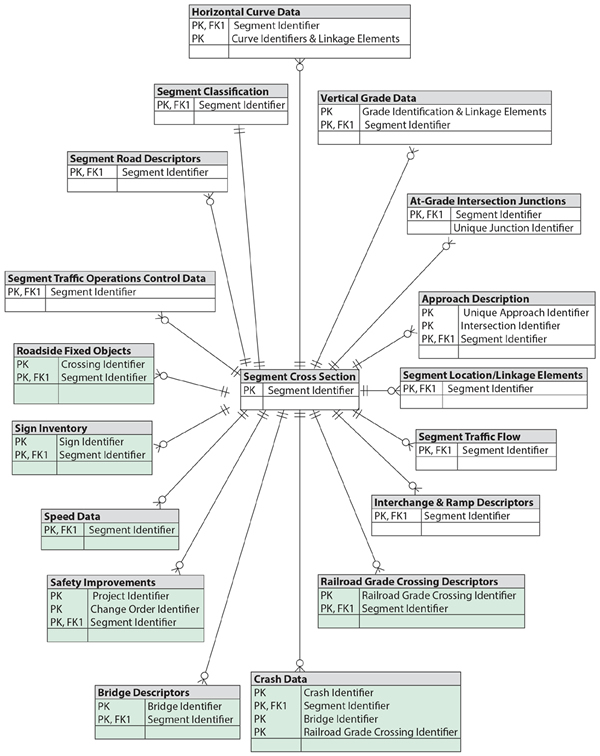
Figure 3. Model MIRE MIS Entity Relationship Diagram.
MIRE MIS DESIGN FUNCTIONS
The following section provides an overview of the potential business requirements that a developer would satisfy if developing the MIRE MIS.
General MIRE MIS Functions
Address key State-approved performance indicators.
The suite of performance indicators will vary among States, but there are three main types of performance measures that can be supported:
Software/system service levels: these are indicators of the function of the software itself, useful in benchmarking and data management by users. Examples include tracking the number of records processed, proportion of records rejected, number of users, and system downtime. These measures would also be useful in tracking the cost of the system, including the costs associated with obtaining and storing the data.
System performance: these are comprised of data gathered to support agencies' indicators of performance in key areas (such as safety, mobility, asset management, etc.). Indicators that could be useful in linking the availability of MIRE-compliant data to improved safety (lives saved, injury levels reduced, and crashes avoided) would be included in this set of measurements.
Data quality: these are measures of the timeliness, accuracy, consistency, and completeness of the data in the MIRE MIS.
Work within context and framework of State-specific approach.
The MIRE MIS must fit within and support a State's existing business practices. For example, States define and combine data across segments in a variety of ways. The MIRE MIS will require flexibility to support multiple segmentation methods including those defined by changes in roadway features as well as those defined by distance, or a combination of both. Varying methods of aggregating data across segments must be accommodated including aggregation based on similar features, by route, by contiguous segments, rolling averages, and others. In essence, the segmentation in the core roadway inventory data will be mirrored by MIRE MIS.
Database Design Technical Diagram
Using a modeling tool such as an ERD or other modeling tools, document State-specific information required for creation of the database.
Modeling tools are useful from the IT perspective in that they provide a succinct view of the data, data sources, and the interactions among those sources. State-specific entity relationships are incorporated into the data model to guide the database design and insure that all necessary inputs, outputs, and linkages are supported.
Develop a technical diagram that identifies the groupings of data and elements used by name and description.
The technical diagram complements the system's data dictionary and the data model described in the ERD by showing the flow of data through the system and the major groupings of data by sources and outputs.
Develop a technical diagram that defines the relationship between the data groups and correctly structures (normalizes) the data.
Data relationships are described as one-to-one, one-to-many, many-to-one, and many-to-many. For example, crashes have a many-to-one relationship with any particular segment in the database. That is, many crashes can occur in one segment. In a fully normalized database, each data element is present once, but can (by virtue of its specific relationships) be accessed through multiple paths.
Document the location and structure of system integration points both for import and export data relevant to the MIRE MIS.
As part of identifying the sources and outputs for the MIRE MIS, all of the points for importing into and exporting data out of the system are defined in terms of the interface requirements, the point in the system's process the import or export occurs, how the operations run (on demand, automated batch processing, as a step in the records management processes at the source, etc.), and how often.
Local Data Validation and Entry
Digital Imaging and Workflow
Provide ability to accept both original data entry and import from other data sources.
In addition to data import points, the system must accommodate manual data entry both from a central location and via remote access (e.g., web-based users with permission to add or update the data). The processes for both importing data electronically and manual data entry will be documented.
Provide ability to validate both electronic transmission and direct data entry based on defined business rules.
Systems evolve over time. It is anticipated that all implementations of MIRE MIS will begin with a set of data validations arising from the MIRE data dictionary as well as any State-specific data definitions that must be accommodated. Over time, as States identify errors that could be trapped through automated means, it is anticipated the number and complexity of validation checks will increase. The MIRE MIS will be designed with a basic set of error checks, but it will also accommodate the addition of new edit checks as defined by the users.
Provide electronic notification for critical and non-critical data errors.
Detect and reject any invalid manual data entry. During any form of automated data import, individual records or items will be flagged whenever any validation rule is violated. These rules generally are grouped by severity into critical (often called "fatal errors") and non-critical ("warnings"). Most commonly, fatal errors cause a record to be rejected—such records are held in a pending database awaiting correction and resubmittal. Errors generating a warning message may be allowed to remain uncorrected—the data are passed into the production database and updated if a correction is received. All errors are logged so that they may be analyzed and used for aggregate reporting of data quality measurements of accuracy, completeness, and consistency.
Establish communication protocol or use existing secure protocols based on industry standard mechanisms.
The MIRE MIS must be capable of one- and two-way communication with various system users, including data collectors, as well as interface with a variety of other systems. These communications typically require a secure connection between the user/source and the centralized system both to insure data integrity and to protect sensitive information from release. MIRE MIS will be designed to accommodate existing secure communications protocols in States where these exist, but it will also require some new communication protocols to be established in some States.
Internet Browser Screens
Provide standard templates for data entry and validation through browser interface.
The MIRE MIS data entry function will be web-based. Screens that open in a browser on a secure website will be built around a standardized template for all MIRE MIS implementations (customizable to meet a State's specific needs). Validation (including edit checks and interfaces with other systems) will take place during data entry and immediately upon submission of the data through the web. Data quality feedback (edit check results) will be provided to the user via the same web interface.
Provide notifications to log and track data input, updates, and deletions.
System management reports available to the custodian of the MIRE MIS records and IT support staff will track user's inputs, updates, and deletions. Error logs will also be stored to support management reporting of data quality.
Provide data collection tools via browser, such as GIS or mobile mapping.
The user interface for data collectors will be web-based. This interface will include standard screens for data entry as well as screens for users to access assistive technologies such as a GIS or map-based location validation and input.
Provide electronic submission for added digital or scanned attachments.
For specified types of entities (such as roadway segments and intersections), the system will provide a means to associate images with the entity. Users will have the option of directly uploading scanned or digital images into an image archive in the MIRE MIS. Because the data and images are associated, data managers and users will have the ability to search images in the database using a variety of search terms limited only by their access to the data elements in the database.
Electronic File Transmission
Provide the ability to accept data from other local or State databases.
MIRE MIS will accept data from local or other State roadway inventory files for which an interface has been defined or provided. This serves to reduce the amount of data that must be entered manually into the system and reduces the cost of data collection to the State by taking advantage of already existing sources—thus reducing redundancy.
Document and publish standards for data collection and transmission.
In order to ensure consistent and error-free data, all entries into the system must be validated prior to acceptance into the production database. A single unified set of validation rules and data definitions will be supplied to all data collectors. In addition, a package for those wishing to implement electronic data sharing (e.g., uploads and downloads) will also be provided with data transmission guidelines and required file structures. A testing protocol for acceptance of electronic data will also be developed and shared with these external sources of data.
Central Data Validation and Entry
Document Imaging and Workflow
Provide an imaging system that contains a database that can provide access to all supporting documentation associated with any roadway segment.
The imaging system supports users by making visual evidence available for review. Because each image is associated with a particular segment, the MIRE MIS also serves as an indexing system for sorting and retrieving of the images as well. While not intended to replace or function as a Photolog system, the image system in MIRE MIS can fill the need for storing of both scanned documents as well as digital photos captured in the field. This can support multiple uses including in-depth engineering analysis (e.g., condition diagramming) as well as asset management.
Receive and validate quality of submitted digital images.
Digital images can be validated by checking the final image record size against the original (as submitted). Another method is to examine the image for both a match to the original submission and already existing images in the MIRE MIS database. In rare cases, such as poor initial image quality, human intervention—a manual review of the images—may be required. These are more a matter of State agency policy and procedures than a function of MIRE MIS; however, the MIRE MIS will support a review of images by the staff.
Scan and index paper documents received from local agencies into a direct-access storage medium, creating digital images of reports and all supporting documentation provided.
In addition to digital photographs, the MIRE MIS image archive will be able to collect and store scanned images (of documents, hard-copy photos, or other materials obtained from local agencies) through digital scanning. As this process will be managed centrally by the MIRE MIS data steward agency staff, it assumed that indexing information will be added (i.e., image "wrapper" information) at the time the materials are scanned. This action will allow the scanned images to be added to the image archive and treated in the same manner, from that point forward, as are the digital images received from external sources (i.e., electronically transmitted to the MIRE MIS).
Provide a unique identifier for each document, including documents received from local agencies.
There are two types of unique identifiers that may be implemented in the MIRE MIS: system assigned and State assigned. The MIRE MIS will assign a unique identifier to each document received as a function of adding the document to the production database. In addition, each State may have its own document identifiers that it can assign (through manual or automated processes) to the documents as they arrive. MIRE MIS could track local agencies' document numbers but these are not assumed to be "unique" in that multiple agencies could conceivably assign the same document numbers to data in their own stand-alone systems. These document numbers are retained so that the State may use them in future contacts with the local agencies (e.g., to discuss a particular document or roadway segment).
Establish a process for returning manual or electronic data to local agencies for correction and track receipt of corrected submissions.
The MIRE MIS error logging and tracking function is designed to support State data quality management processes fully. Submitted data are automatically examined for errors. Each error is recorded as part of the "as submitted" data. Submitted items with critical (fatal) errors are automatically rejected (i.e., not added to the production database) and are held in a pending status until those serious errors are corrected or (at the State's option in some cases) over- ridden. Non-critical errors (i.e., those that generate a warning only) may be handled in a number of ways (at the State's option). Typically, non-critical errors are noted but the data themselves are not barred from addition to the production database. States may choose to hold the erroneous data in a pending status awaiting correction or not. In any case, the MIRE MIS supports notification of the submitting agency/staff of both critical and non-critical errors through case-level and aggregate reports. Case-level reports are specific to an individual record or data item that contains a critical error that must be corrected. Aggregate reports summarize the errors noted from each data submitter over some defined period (e.g., monthly, quarterly, or annually). The latter are a useful source of feedback to the submitting agencies and may be helpful in designing training content or revising data collection instructions/manuals. Finally, the MIRE MIS retains a log of all errors and all reports that contained an error. A tracking system is established that uses this information to generate reminder notices for any errors that have not been corrected by a specified time (e.g., two weeks after notification). These notices are provided to the system's administrators automatically and may be sent electronically to the submitting agencies responsible for correcting errors.
Establish automated workflow routings and work queues for data transmitted from other systems (e.g., pavement management systems [PMS], bridges, crashes).
The MIRE MIS supports agency workflows by notifying designated staff when a record matching an established routing definition is added to the system. These may be useful in a number of situations. One example is to establish work queues for internal staff (e.g., location coders, data quality managers, etc.). Another example may be to provide roadway inventory data for external users such as the Fatality Analysis Reporting System (FARS) analysts who may need accurate roadway segment descriptions to add to their records of fatal crashes.
MIRE MIS Application
Develop MIRE MIS application and relational database.
This is the main system development task and takes place after all the functions and State- specific modifications have been described. (Development of a prototype is described in further detail in the next section.)
Capture Graphical User Interface (GUI) input screens that enable keying from image or paper processes if needed, including split screen.
This task results in the main data entry system and process control screens for centralized scanning. It supports the paper-management process at the agency serving as the steward of statewide roadway inventory data. The same (or similar) data entry screens may be made available to external users in a form suitable for web-based remote data entry.
Establish an intuitive flow for data entry and include features such as highlighting, table driven drop down lists, pre-populated fields, capturing system dates, etc.
The MIRE MIS data entry process will support high quality data entry through user assistance and constraints. Pick lists, for example, serve to constrain users' inputs in comparison to entries made into a free text field so that only allowable information (data that will pass basic system edits) may be entered. Highlighting of specific fields during data entry helps users identify errors and mandatory data fields so that these may be addressed during initial data entry rather than waiting until the report is submitted.
Provide ability to flag items and data elements based on Federal and State rules, close out year rules, etc. (e.g., data used for the Highway Performance Monitoring System [HPMS], data used for SafetyAnalyst, data on-system/off-system).
These flags maybe treated as a specific type of validation rule which results in mandatory corrections (if the data as entered do not meet the reporting requirements) and for work-flow routing (e.g., flagging relevant data items for the staff responsible for HPMS, Highway Safety Information System [HSIS], etc.).
Provide ability to search/access digitized documents.
In the search/access function, the entire coded portion (all database contents with the exception of images) of the MIRE MIS can serve, if desired, as the indexing system. This means that users with the appropriate access permissions could obtain digitized documents matching any specified search criteria that would apply to non-image data. The search function will support both simple and complex queries. Simple queries are those that make use of one or a limited number of filters. Complex queries are those that may require the use of a query builder tool or a query model in order to ensure that all the tables in the MIRE MIS are accessed correctly. Queries result in a standardized list report that lists all data matching the search criteria. These may be fed into a reporting system that can generate output that is more advanced. The search of the digital image archive works in a similar way with the addition of the capability to specify a particular document type of interest (e.g., photo, scanned report, all images, etc.). In addition to this powerful query function designed for internal users of the MIRE MIS, it is also possible to support external users (and less-technical internal users) through a constrained query tool made available online. This tool is designed to allow users to build a query by selecting from among allowed data fields, establishing sort and filtering options, date ranges, and other criteria.
Support the designated number of internal and external users.
MIRE MIS stewards may establish limits on access to the system. Each user must establish an account that is secured with a login ID and password. The system's administrators can establish user access levels by class (e.g., administrator, database manager, general user, data entry, etc.) and for each individual (i.e., users may be granted selective access to some portions of a higher level class without being given the full permissions associated with that pre-defined class. Permissions may be established at the row level and for each database column independently to allow individual users (and classes of users) permission to view, edit, and/or delete information as separate permissions established in the user profile.
Mapping Tools
Provide an on-line, point-and-click, mapping location tool for data entry.
As a proven way to increase location data accuracy, users responsible for entering data will have access to a "smart map" which gives them a point-and-click interface for entering location data. Users can call up the map, zoom, pan in any direction, and click on the precise location of interest. The map will then supply all required location information and auto-populate the relevant fields on the data entry form. This may include latitude/longitude coordinates, roadway name(s), route number(s), segment ID number, milepoint/milepost, and any other information that is available from within the department's or State's GIS. If a Statewide GIS does not exist, it is possible to implement the smart map capability using generic mapping tools (e.g., Google Earth™).
Support a multi-linear referencing system.
MIRE MIS can incorporate translation tables to support multiple location coding methods including latitude/longitude, milepoint, milepost, and others. Ideally, the information is available within a GIS and the act of clicking on the smart map generates the relevant location information for entry into the MIRE MIS. Where this is not feasible, the MIRE MIS will still have the capability to store multiple location codes and the State can use the information entered into the MIRE MIS to develop the desired translation tables.
Central Data Review and Analysis
Database
Provide for MIRE MIS retention and archiving as determined by State.
Each State may establish its own retention and archival process for MIRE MIS. The system can generate an archive file organized by year, which the State can then store separately. Archived data may be accessed through the MIRE MIS by the reverse process of "reattaching" the archive to the system at which the archived data become another database source that can be searched and used in analyses.
Provide a scalable and secure relational database with backup and recovery procedures.
The MIRE MIS is designed to work well regardless of the volume of data. The database is secure with administrator control over user access and permissions. Backup and recovery are supported through automated and administrator-controlled processes.
Analysis Tools
Provide web enabled analysis tool for authorized user groups.
Authorized users may access a set of web-based analysis tools that include search and report generating functions. The search tool will be designed to enable users to quickly specify criteria such as date ranges and selection/filtering criteria based on any column in the database to which they are allowed access. The search feature results in a list of matching rows that is then available for use in analyses. From the user's perspective, the selection criteria and report specification are just two steps in the process of generating a desired output from the system. Multiple user-generated output types are supported including a simple list report, one-way and multi-way cross tabulations, graphic displays, and data extracts. The State may specifically limit users as to which types of report they may obtain.
Support Export of Data for HPMS
Support export of data for SafetyAnalyst and other tools as approved.
With any known standard for data submissions, MIRE MIS can be programmed to generate a compliant data extract. The system will be developed with the capability to provide data extracts matching the HPMS and SafetyAnalyst data input requirements. System administrators will have access to a tool that will allow them to update these output definitions and create new ones as the need arises.
Allow retrieval of roadway and crash data for proposed safety projects.
The MIRE MIS search and reporting functions support the intended use of the data in support of safety projects by providing authorized users a way to select relevant data and generate output reports. The search feature's output of a simple list of matching rows also supports users' access to individual items including inventory, crash, traffic, and any other data available through MIRE MIS. One possibility is that the data could be accessible through a GIS providing users with a map-based interface that would allow them to click on a location, call up crash reports for that location along with the related inventory and traffic data. This functionality is supported by MIRE MIS as it can provide data to an external GIS. MIRE MIS's web-based spatial analysis tool supports this capability for authorized users.
Provide analysis tools to authorized users in the form of queries and ad hoc reports from MIRE MIS.
The analysis functions within MIRE MIS are not constrained—every field in the database can be used in a query or report. User permissions established by the administrator control which fields are available to a particular user. The internal query and reporting capabilities are akin to those described for a general user audience via the web. In fact, the same tools are available to both users, but the one intended for general user access is constrained in that selected fields are not available for query or analysis. Internal users can access any field as long as they have the appropriate permissions as established by the system administrator.
Spatial Analysis Tools
Provide a web enabled spatial analysis tool for authorized user groups.
Authorized users will have access to a spatial analysis tool that can generate cross tabulation reports and support map-based output of results.
Provide ad hoc reporting ability for spatial analysis tool.
The ad hoc reporting capabilities of the spatial analysis tool include one-way and multi-way cross tabulations, and reporting of frequency counts and proportions (percentages).
Provide graphical depiction of analyses based on, for example, road sections, bridges, and intersections for specific timeframe and weather conditions.
Users of the web-based spatial analysis tool will have the option of producing graphical output in addition to the tabular reports. The graphical output may include support for condition diagrams, intersection/site diagrams of crashes, frequency histograms, pie charts, line graphs, and others.
Central Data Distribution
Ad Hoc User Reports
Provide reports, queries, and/or inquires defined by the State, such as proposed safety project information.
The analytical tools designed for MIRE MIS support user-generated ad hoc query and analysis functions. Any query or analysis defined in the system may be saved for future use and shared with other users.
Standard Reports
Allow authorized users to view and generate pre-defined reports, queries, and/or inquires via a browser.
State-defined standard reports are established in the system in the same way as ad hoc reports. They are simply saved and shared with the user community in general. The web-based analysis tool will allow users to access any pre-defined query or report accessible to them based on their permissions established by the system administrator. Users will be blocked from generating output from a standard/pre-defined report for which they do not have the required user permissions as established by the system administrator.
Provide an interface for submitting requests for additional standard reports via browser.
Users may request database searches and reports (i.e., analytic assistance) by completing a form available online. The MIRE MIS system will log and track all of these user requests. It will also support workflow routing of requests to the appropriate agency staff.
Government Reports
Generate mandated and standard reports for Federal agencies.
MIRE MIS will be programmed with a series of standard reports meeting the requirements established under Federal programs. These report definitions will be accessible to the relevant agency staff so that they can be modified in the future as reporting requirements change.
File Transmissions
Provide aggregate information to other agencies and organizations via various media or through direct file transmission.
MIRE MIS will support electronic sharing of reports through creation of portable document format (PDF) output. The system will also support data transmission by allowing users to define data extracts, which can then be shared electronically. The system administrator in the user profile will establish user permissions for the creation of data extracts.
User Assistance Modes
Embedded help file and help file index.
MIRE MIS documentation will be used to generate a help file that will be available to users from within the system interface by clicking on the "Help" button. The embedded help will document all user-accessible system features and the functioning of each option in the user interface.
Reporting and standards instruction manual.
MIRE MIS data definitions and relevant data validation checks will be documented in an instruction manual for data collectors. The same manual can be shared with analysts using the system so that they can be made aware of the conditions for data acceptance into the production database.
Context-sensitive help on data entry fields.
For data entry fields on any data entry form, users may access help in the form of information derived from the data collector's instruction manual. This will include the data definition for that field, instructions for completing data entry into the field, and relevant validation rules for that field.
Step-by-step system function assistance ("show-me-how").
For user-accessible functions defined in the system, the help file will contain step-by-step instructions on how to access and complete a desired task using that function. This type of user assistance is akin to a "show-me-how" set of steps that take the user through every step in the process.
Function completion wizards ("do-it-for-me").
For selected user-accessible functions, a wizard-based utility will provide users with expert-level automatic task completion. This is akin to a "do-it-for-me" command that will launch a default sequence of instructions and form completions by the system. Since it is impossible to anticipate every possible user need, this type of wizard-based approach effectively supports only the most standardized (routine) tasks; however, the wizards also serve an important training function within the system as it provides users with a complete and correct example upon which to base their own future uses of the system.
Interactive tutorials.
The MIRE MIS also includes a set of interactive tutorials. These are delivered as an animated, annotated slide show with multiple branching opportunities in which the user controls the forward progression based on choices made at each step in the process. This type of tutorial is a powerful user aid since it provides full step-by-step examples of task completion using the system. The ability to annotate key features of the presentation make this a good learning tool as well since users may be presented with options and explanations while they are working through the programmed examples.
The MIRE MIS design assumes that roadway-related and supplemental databases already exist in some form. For example, States may not yet be collecting data on approaches, ramps, and intersections. In this case, agencies should establish a policy to determine whether they would enter newly collected data into a separate database from the MIRE MIS or modify an existing database to accept the additional data. Since MIRE MIS will be a decision support system for safety analyses, the agency should establish a separate subject matter database rather than entering data directly into the MIRE MIS. In this manner, the agency will only export the specific data elements needed for safety analyses to the MIRE MIS database while maintaining operational integrity for other uses of these data.
HOUSING SAFETY DATA IN THE MIRE MIS
The MIRE MIS should store safety data in a relational database. The relational database model has several advantages over other methods of storing data, such as a flat file database. A flat file database collects all stored information into a single table. This table may have many fields for each record stored in the list. In a flat file system, there is often duplicate information stored in these fields, or there could be data duplicated across several flat file systems. These systems require more storage and use more system resources than a relational database. A relational database uses multiple tables to store data. The data within each table is related, but relationships are also defined between data in one table and data in other tables in the system. These relationships are built by defining a PK for each table. A PK is one or more columns in a table that can be used to uniquely identify a single row in the table. For example, a route table would have some PK such as route identifier. A roadway segment table would have a column for primary route, which would "point to" the row in the route table. This column in the roadway segment table is the FK. When a relationship is defined between a PK in one table and an FK in another table, the two tables can be "joined", correlating all of the data in the two tables. In a larger relational database, there may be many such relationships defined. This structure has several important benefits for the MIRE MIS. The relational database model uses storage more efficiently and will perform better than a flat file with a large dataset. This makes it easier to scale the MIS. This system is also better suited to ad hoc queries and reporting, which will support the advanced analysis required to support safety decisions using this system.