| Project Overview | |
| Project Location: | A 26.1 mile segment of the US Highway 2 corridor located west of Kalispell, Montana. |
| Project Environment: | Rural |
| Project Design Stage: | Existing roadway |
| Project Owner(s): | Montana Department of Transportation |
| RSA Overview | |
| Date of RSA: | June 10-12, 2013 |
| RSA Stage(s): | RSA of existing roads |
| RSA Team: | Representatives from the Federal Highway Administration , Flathead County, Montana Highway Patrol, Montana Department of Transportation, and Vanasse Hangen Brustlin, Inc. |
| IHSDM Overview | |
| Information Provided by Roadway Owner: | As-built construction plans.
Elevation data from MDT. Traffic data from MDT. Crash data from MDT. |
| IHSDM Modules Utilized: | Policy Review Module: Length of Curve and Radius of Curve.
Design Consistency Module. Crash Prediction Module. |
RSA No. 2 – Project Background
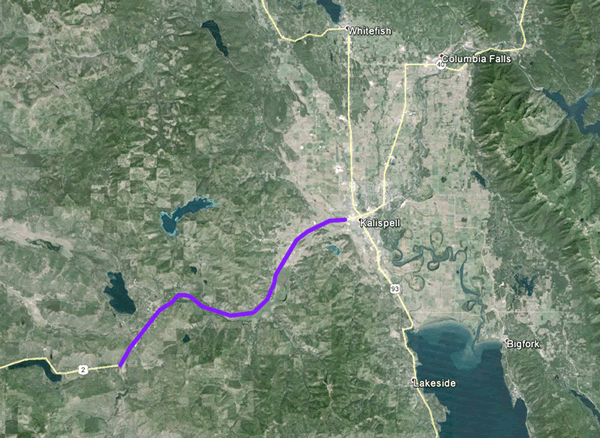
Figure 10: US Highway 2, Kalispell, Montana RSA Location (Purple).
In 2009, at the Montana Department of Transportation (MDT) Comprehensive Highway Safety Plan (CHSP) Annual Meeting, traffic safety stakeholders agreed that the long-range highway safety goal for Montana is to cut the number of fatalities and serious/incapacitating injuries in half by 2030 from 1,704 fatalities and serious injuries in 2007 to 852 in 2030. One
of the strategies established by MDT, through the High Crash Corridor/High Crash Location Emphasis Area in the CHSP, is to conduct two Corridor Safety Audits (CSAs) on high crash corridors each year.
The segment of US Highway 2, from milepost (MP) 93.5 to MP 119.6 was identified by MDT as a High Crash Corridor. This corridor had a higher crash rate and crash severity index, which is the ratio of the sum of the level of crash severity to the total number of crashes, than the statewide rural National Highway System (NHS) average. Between 2007 and 2011, the US Highway 2 corridor had a crash rate of 1.99 crashes per million vehicles miles of travel, compared to the 1.01 crashes per million vehicles miles of travel statewide rural average. The severity index was 2.42 for US Highway 2 and 2.05 for the statewide rural average.
A 26.1 mile segment of the US Highway 2 corridor, shown in Figure 10, was selected for the RSA. The environment varies from rural areas, to smaller residential areas, and more dense residential areas with a primary school located directly off of US Highway 2 near MP 115. The roadside characteristics vary as well, with much of the study area having steep slopes or fixed objects including trees and rocks. Commercial vehicles, particularly quarry and logging trucks, also use this route heavily and a weigh station within the study area is scheduled to be reopened.
Within the assessment area, US Highway 2 is a two-way, two-lane road consisting of a 12 foot wide travel lane and shoulders varying in width. In the IHSDM study area, from MP 99.34 – 109 as shown in Figure 9, the shoulders were approximately one foot. There is one intersection with a flashing beacon and there are no signalized intersections along this corridor. There are numerous unsignalized intersections and driveways within the study area.
The posted speed limit on US Highway 2 ranges from 60 to 70 miles per hour (mph) with a 45 mph school zone within the study area.
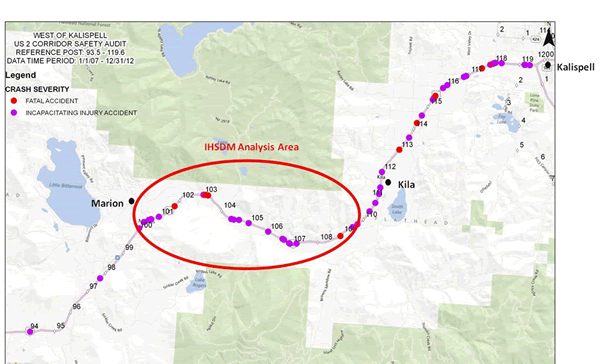
Figure 11: RSA and IHSDM Analysis Area.
RSA No. 2 – Use of IHSDM
While the RSA encompassed a larger area, IHSDM was used for an approximately 9.5 mile section of US Highway 2, from MP 99.34 to MP 109, where crash rates were among the highest on the corridor and where roadway geometry was suspected to play a significant factor in those crashes (Figure 11).
There were three IHSDM modules that were utilized prior to the RSA and used to identify locations of interest for this RSA.
The IHSDM analysis produced output tables and graphs that illustrate locations where AASHTO policy values for horizontal curve length and radius were not met, the 85th percentile speed profile for the corridor traveling in each direction (and any accompanying "flagged" elements), and projected crashes along the alignment. The output for these analyses can be summarized as follows:
PRM
- Length of Curve: Five locations did not meet the 2011 AASHTO minimum criteria for length of curve.
- Radius of Curve: One location did not meet the 2011 AASHTO minimum criteria for radius of curve.
DCM
The output from this module showed that from an approach tangent to its succeeding horizontal curve, several locations were flagged for significant reduction in estimated 85th percentile speeds:
- Four locations had a speed differential of adjacent design elements that was between six (6) and 12 mph (yellow flag).
- One location had a speed differential of adjacent design elements that was greater than 12 mph (red flag).
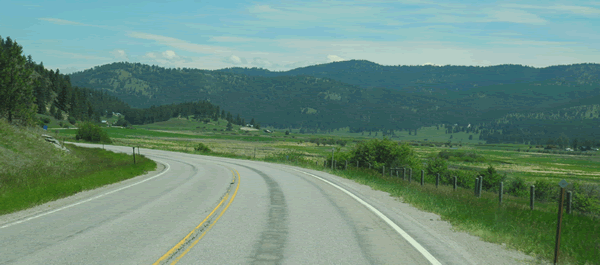
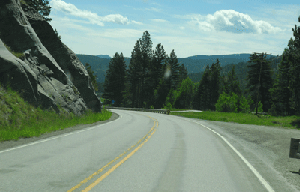
Figure 12: Eastbound on US Highway 2 in Kalispell, Montana, at the curve near MP 108.9.
This location was identified by PRM as a curve that did not meet the minimum criteria for lengths and DCM, where it was flagged for a critical reduction in the estimated 85th percentile speed from an approach tangent to its succeeding horizontal curve.
CPM
Five years of site-specific crash history (January 1, 2007 to December 31, 2012) was used (102 reported crashes) for the CPM analysis with the analysis period being 2013-2018, which is recommended for locations which have similar characteristics in the "before" and "after" analysis periods. The results were 86.49 total crashes for the analysis period with a crash rate of 1.79 crashes/mi/ yr. The sections of the roadway with the highest expected crash rates were on or adjacent to curve segments of the roadway.
A summary of the IHSDM graphs is shown in Figure 13. The output from the various modules was compared through tables and maps to help define the order of magnitude of risk for different locations. Figure 14 is an example of the mapped results.
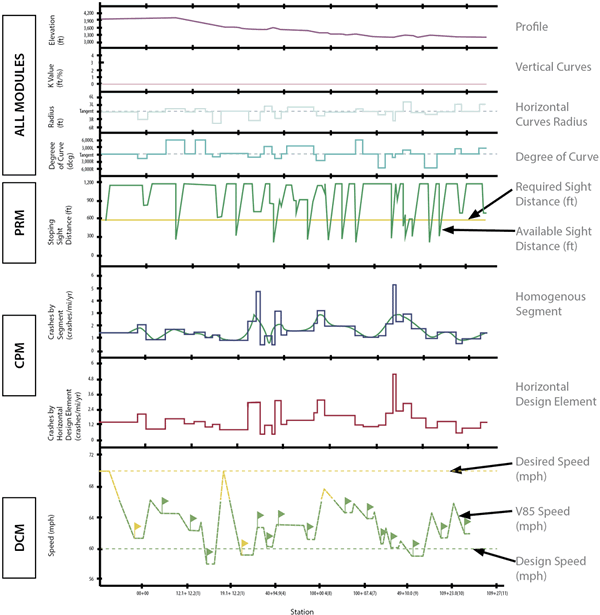
Figure 13: Summary of US Highway 2 IHSDM Graphical Output.
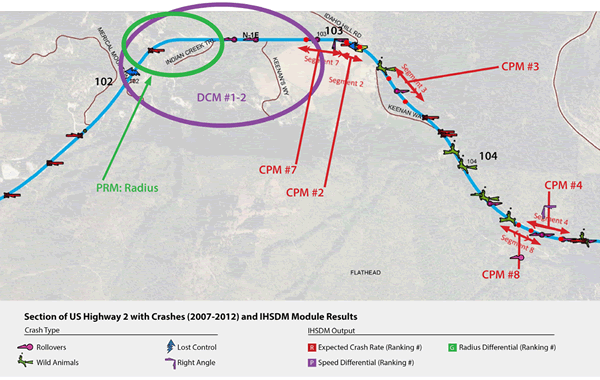
Figure 14: Section of US Highway 2 with Crashes (2007-2012) and IHSDM Module Results.
RSA No. 2 – Key RSA Findings and Suggestions
The RSA team reviewed the US Highway 2 corridor utilizing recent crash data, local and RSA team inputs, and the interactive Highway Safety Design Model (IHSDM). IHSDM was used to help select sites for detailed review and to help identify priority areas where improvements should be considered. The results of IHSDM identified the following locations as critical "spot" locations along the corridor:
- Rustic/Gopher Road Intersection.
- Kila Road (near MP 112) Intersection.
- Batavia Lane Intersection.
- West Valley Drive Intersection.
- Dern/Springcreek Intersection.
A summary of the key safety issues at the hotspot locations and suggested mitigation actions for the US Highway 2 RSA is provided in Table 5.
Table 5: US Highway 2, Kalispell, Montana: Key hotspot safety issues and mitigating actions.
| Selected Safety Issue | Suggested Action |
|---|---|
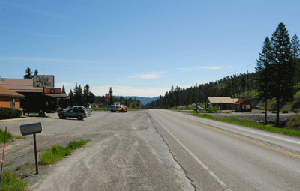
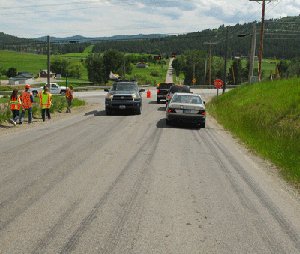
| Change in surrounding land use There are areas that change from rural to more developed without warning. Drivers traveling at elevated speeds on US Highway 2 may not expect the vehicle speed differential associated with vehicles entering from driveways, wide access points, and intersections.
Eastbound view of intersection and parking/access locations just after horizontal curve. Motorists may not expect vehicles entering the roadway given the rural nature. |
Intermediate Range: Consider installing advanced intersection warning signing with street name signage. Long Range: Consider implementing access restrictions at wide access points to define desired traffic movements. |
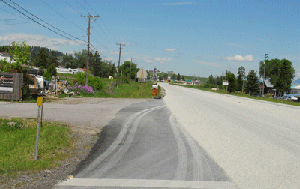
| Student Crossing At a crossing near a school on US Highway 2, vehicle speeds were reported to be high, near misses between vehicles and the crossing guard were reported, and vehicles parking on the street near a gas station were blocking the view of students in an adjacent crosswalk.
Eastbound view from intersection of US Highway 2 and Batavia Lane. Gas station access is to the left. Vehicles pull into the gas station to drop their kids off for school, requiring the students to cross Batavia to access the school. Vehicles park along the front of the intersection, potentially obstructing the view of students crossing Batavia in the crosswalk. |
Short Range: Implement an educational campaign targeting speeds in the school zone. Work with the MDT Community Transportation Enhancement Program (CTEP)/Transportation Alternatives (TA) Program to investigate the possibility of infrastructure improvements or educational programs. Evaluate the 45 mph speed zone location. Evaluate driver speed feedback signs. Increased speed and crosswalk enforcement. Install no parking signs in front of the gas station and stripe that portion of roadway as right turn lane/tapered right turn lane. Long Range: Investigate potential intersection modifications to reduce speed of right turning traffic onto Batavia. Investigate a grade separated pedestrian crossing of US Highway 2. |
| Intersection proximity One location has two intersections in close proximity, potentially causing confusion among drivers performing turning movements or entering the roadway. |
Short Range: Consider options to enhance warning or to provide advance warning. Enhance pavement markings to provide positive guidance to drivers regarding the multiple intersections, clarify traffic priority, and enhance intersection operation. Conduct a traffic signal warrant study. Evaluate the options of a roundabout and/or dedicated turn lanes. |
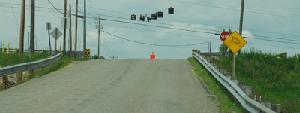
| Intersection located on a combination horizontal and crest vertical curve The limited sight distance in combination with high speeds along US Highway 2 increase the crash risk at the intersection with Dern/Springcreek Road.
Westbound view of US Highway 2 from Springcreek Road. The horizontal and vertical curve limits the sight distance on US Highway 2, so drivers may not see vehicles entering/crossing from Dern/ Springcreek Roads.
Northbound on Dern Road, approaching the intersection with US Highway 2. The intersection is on the crest of a vertical curve limiting sight distance. |
Intermediate Range: Investigate Intelligent transport systems (ITS) options to provide additional information to mainline drivers of conflicting traffic. Long Range: Evaluate a more robust improvement leveraging Federal-aid funds such as Highway Safety Improvement Program (HSIP) funds to reconstruct the intersection. |
The RSA team used the IHSDM output to evaluate several of the critical roadway segments and curves on the corridor and identify systemic issues associated with these locations. The following is a summary of the critical segments and curves identified through IHSDM:
- Section with horizontal curve near Pleasant Valley Road intersection.
- Horizontal curve near MP 102.4.
- Horizontal curve near MP 103.
- Section between MP 103.5 and MP 105.
- Section between MP 106 and MP 107.5.
- Horizontal curve near MP 108.9.
A summary of the key safety issues and suggested mitigation actions developed by the RSA team for the road segments/curves on US Highway 2 is provided in Table 6.
Table 6: US Highway 2, Kalispell, Montana: Key systemic safety issues and mitigating actions.
| Selected Safety Issue | Suggested Action |
|---|---|
| Horizontal curve crashes There were a number of crashes occurring along horizontal curves.
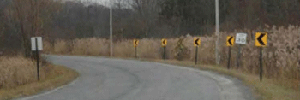
Horizontal curve near MP 107. An example of one of the many horizontal curves in the study area, the curve has limited sight distance, a pull-out located within the curve, and lacks signage. |
Short Range: Implement a systemic approach to marking curves, such as installing chevrons or chevrons of increasing size, based on relevant criteria (e.g., radius, length, crashes, grade). Short\Intermediate Range: Implement shoulder widening on the outside of select curves meeting relevant criteria (e.g., x crashes, y radius).
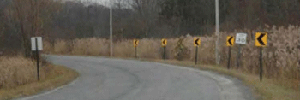
The upper photo is typical chevron size and placement. The lower photo demonstrates use of increasing chevrons, which include a slightly modified placement and placement so that they increase in size through the curve. (Source: Rensselaer Polytechnic Institute) Intermediate/Long Range:Remove conflicts on curves with limited sight distance (e.g., pull-off areas). Conduct curve monitoring through Highway Safety Improvement Program (HSIP) and consideration of additional enhancements (e.g., dynamic curve warning signs). |
| Speed Speed was a factor in 15 percent of the crashes along the corridor. Speed differential is also a concern along the corridor. The RSA team observed heavy vehicles traveling at high speeds and passing slower vehicles. Also, with the complex roadway geometry, animal presence, and lack of street lights, unfamiliar drivers may not be comfortable driving the speed limit. This discrepancy in speeds can result in a violation of driver expectancy.
Southbound on Springcreek Road, approaching intersection with US Highway 2, the RSA Team observed multiple sets of skid marks starting near the top of the vertical curve and approaching the intersection. The skid marks may be an indication that drivers may not realize they are approaching the intersection at high speeds, or that they were not expecting a vehicle queue at the stop sign. |
Short Range: Implement the state single vehicle run-off-the-road campaign. The intent of this project is to develop statewide and/or regional media campaigns educating motorists on road departure crashes. Short/Long Range: Investigate speed reduction measures such as mobile or permanent speed feedback signs in critical locations. Consider those measures that provide a shared benefit. For example, increasing chevrons are potential measure providing increased horizontal curve warning, but they also help to reduce speeds (see horizontal curve crash section, 3.2.1.1) Intermediate Range: Investigate the difference between design speed versus 85th percentile speed and enforcement speed throughout the corridor. There is currently a proposed research safety project to investigate the safety impacts of speed differential between commercial and passenger vehicles. |
| Road Departure/Single vehicle run-off-the-road (SVROR) crashes Thirty five percent of crashes were road departure/SVROR crashes (including overturn crashes, fixed object, and lost control crashes). |
Short Range: Utilize the district wide curve signing project. Short\Intermediate Range: Implement corridor-wide delineation and signage upgrades. Potentially delineate the higher volume private approaches. Implement the statewide single vehicle run-off-the-road departure media campaign. |
| Intersection Related Crashes Many of the crash locations were at intersections or were intersection-related (such as right angle and rear end crashes). A plot of crash frequency indicated peaks at intersections. |
Short Range: Implement corridor wide advanced intersection warning with street name signs. Short\Intermediate Range: Implement corridor wide delineation and signage upgrades. Potentially delineate the higher volume private approaches. |
| Location of Pull-outs Many of the pull-outs were in locations with limited sight distance.
Eastbound on US Highway 2 showing the curve near RP 107 and gap in guardrail created by the presence of pull-out. Drivers that use the pull-out have limited sight distance making it difficult to pull-out and gain speed so they are not overtaken by faster vehicles driving the 70 mph speed limit. |
Short Range: Evaluate pullout locations and remove/relocate as appropriate |
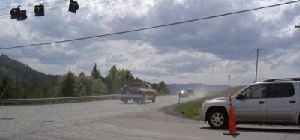
| Skewed intersections A significant number of intersections were skewed. The skew allows for higher speed interactions from some directions and much lower speed interactions from other directions. Also limits driver's ability to see traffic in all directions as well as increases exposure for vehicles crossing the mainline.
Westbound on US Highway 2, approaching Rustic/Gopher Road Intersection. Right turning vehicles must navigate a sharp turn, requiring them to slow down significantly on the high speed roadway. |
Intermediate Range: Evaluate and prioritize individual intersections for possible realignment to decrease intersection skew. |
RSA No. 2 – Conclusions
The RSA team reviewed the US Highway 2 corridor utilizing recent crash data, local and RSA team inputs, and IHSDM. IHSDM was used on a portion of the corridor to help select sites for detailed review and to help identify priority areas where improvements should be considered. Areas with crash potential, identified through IHSDM, were investigated in the field and helped focus the team’s efforts. This was particularly helpful as many of the crashes in the section analyzed were widely dispersed. IHSDM identified several critical "spot" locations along the corridor as well as horizontal curves.
Critical horizontal curves were identified using IHSDM and their common features were identified and verified in the field. These features include:
- Sharp curves (curves with small radii).
- Curves on steep grades or at the end of steep grades.
- Curves with intersections or access points within or in close proximity to the curve.
Treatments for these locations included the following:
- Removing or relocating roadside hazards.
- Providing a recovery area (e.g., curve widening).
- Utilize a systemic approach to install/improve curve warning signs, to include evaluating alignment by conducting a ball-bank test.
- Investigation of guardrail installation in select locations.
- Evaluate speeds and investigate speed management measures.
- Increased access management.
- Additional enforcement measures.
In summary, the use of IHSDM emphasized the need for additional measures to improve safety on horizontal curves.

