USA Banner

Official US Government Icon

Official websites use .gov
A .gov website belongs to an official government organization in the United States.

Secure Site Icon

Secure .gov websites use HTTPS
A lock ( ) or https:// means you’ve safely connected to the .gov website. Share sensitive information only on official, secure websites.

U.S. Department of Transportation U.S. Department of Transportation Icon United States Department of Transportation United States Department of Transportation

Noteworthy Practices

Permissive/Protected Left Turn Phasing in Detroit and Grand Rapids

Original publication: Permissive/Protected Left Turn Phasing (FHWA-SA-09-015)(PDF, 441kB)


Left-turning movements are generally acknowledged to be the highest-risk movements at intersections. An estimated 27 percent of all intersection-related crashes in the United States are associated with left turns, with over two-thirds of these crashes occurring at signalized intersections (O'Connor, T., “Intersection Collision Avoidance Systems Web Page,” California Center for Innovative Transportation, August 2004). The cities of Detroit and Grand Rapids, Michigan, were concerned about the high number of crashes at some of their signalized intersections.

The cities modified the permissive left-turn mode to a permissive/protected mode at 3 intersections experiencing a high incidence of crashes, many with injuries and many due to left-turn head-on crashes.

"Two side-by-side photos of permissive-protected signal heads, with the photo on the left showing the permissive phase (circular green) and the photo on the right showing the protected phase (left-turn arrow)."
Figure 1:   Permissive/Protected Mode
Photo courtesy of Michigan Department of Transportation (used with permission).


Key Accomplishments

As the Michigan experience demonstrates, low-cost improvements can effectively improve safety and reduce traffic crashes and their resulting injuries.

Results

The enhanced countermeasure installed at these signalized intersections cumulatively reduced total crashes by approximately 32 percent, injury crashes by 58.9 percent, and left-turn head-on crashes by an average of 84 percent per year.

Contact

Tapan Datta
WSU-Transportation Research Group, MI
tdatta@eng.wayne.edu

Cities of Detroit and Highland Park, MI Implement Low-cost Strategies That Measurably Improved Safety

Original publication: Improving Safety by Providing All-Red Clearance Intervals and Larger Signal Lenses (FHWA-SA-09-014)(PDF, 563kB)


Red-light running is estimated to cause more 170,000 injuries and approximately 900 deaths per year (FHWA, Red-Light Running Web Site). Some of these crashes occur because of driver speeding, distracted driving, or inability or failure to see the traffic control device in time to comply. The cities of Detroit and Highland Park, Michigan, were concerned about the high number of crashes, particularly angle crashes, at some of their signalized urban intersections.

The cities of Detroit and Highland Park implemented all-red clearance intervals and larger signal lenses at 33 intersections experiencing a high incidence of crashes (particularly angle crashes), many with injuries.

""Photograph of a 4-way signal head in which the red light lens is 12 inches in diameter and the yellow and green lenses below it are 8 inches in diameter.
Figure 1: Relative size difference between 12-inch (top lens) and 8-inch signal lens (bottom lenses)


"Map of the Woodward Avenue Corridor"
Figure 2:   Site Map of the Woodward Avenue Corridor


Key Accomplishments

As the Michigan experience demonstrates, low-cost improvements can effectively improve safety and reduce traffic crashes and their resulting injuries.

Results

The combinations of enhanced countermeasures installed at these Michigan signalized intersections cumulatively reduced total crashes by approximately 33.3 percent and injury crashes by an average of 45.5 percent per year. Angle crashes were reduced by a significant 75.7 percent per year at the treated intersections.

Contact

Tapan Datta
WSU-Transportation Research Group, MI
tdatta@eng.wayne.edu

Minnesota Roundabout - A Scott County Success Story

Original publication: Minnesota Roundabout - A Scott County Success Story (FHWA-SA-09-013)(PDF, 587kB)


Two fatal crashes and 50 injury crashes occurred in a five-year period at the rural, two-way stop, high-speed intersection of Highway 13 and County Road 2 in Minnesota. Attempts to reduce crash frequency with a variety of safety treatments at the intersection (including larger stop signs, striping, and flashing lights) were relatively unsuccessful.

The Minnesota Department of Transportation (Mn/DOT) sought to reduce crashes by converting the two-way stop controlled intersection to a single-lane roundabout. The roundabout was constructed with a central island 110 feet in diameter.

""Photo of the roundabout installed at the intersection of Highway 13 and County Rd 2 in Scott County, MN
Figure 1:   Intersection of State Highway 13 and County Road 2
Photo by Jody K. Hassel (used with permission)


"Diagram showing the eight potential vehicle conflict points on a standard two-lane roundabout"
Figure 2:   Eight vehicle conflict points
Source: FHWA Roundabouts: An Informational Guide


""Diagram showing the 32 potential vehicle conflict points on a standard two-lane roundabout
Figure 3:   32 vehicle conflict points
Source: FHWA Roundabouts: An Informational Guide


Key Accomplishments

The Minnesota Department of Transportation (Mn/DOT) sought to reduce crashes by converting the two-way stop controlled intersection to a single-lane roundabout. The roundabout was constructed with a central island 110 feet in diameter.

Results

Converting this intersection to a roundabout resulted in a 76.2 percent reduction in total crashes and a 78.7 percent reduction in injury crashes. Angle crashes were eliminated.

Contact

Anthony Winiecki
Scott County Public Works Department
Jordan, MN
336-747-6867
twiniecki@co.scott.mn.us

Signal Flashing Mode Removed During Late-Night/Early-Morning Operation

Original publication: Removal of Signal Flashing Mode during Late-Night/Early-Morning Operation; FHWA-SA-09-012; 2009 (PDF, 379kB)


For years, it has been standard practice to operate traffic signals in the flashing mode when traffic volumes are low, typically during late-night/early-morning hours. Recognizing that field studies have indicated that crash rates may increase around traffic signals using flashing operations during late-night/early-morning conditions (Source: S.F. Polanis, “Right-Angle Crashes and Late-Night/Early-Morning Flashing Operation: 19 Case Studies,” ITE Journal, April 2002). The City of Winston-Salem, North Carolina was concerned about the high number of crashes at urban signalized intersections operating in the flashing mode during late-night/early-morning hours.

The City of Winston-Salem changed signal operations from flashing mode to steady (stop-and-go) mode during late-night/early-morning hours at 8 intersections experiencing a high incidence of injury crashes, particularly right-angle crashes. The eight intersections ranged in size from one-to-three lanes in each direction, with most being two-lane intersections. All of the intersections had a speed limit of 35 mph (with one 30 mph cross street).

"Early morning photograph of a rural road with non-flashing traffic lights"
Figure 1   Photo by Ron Schaefer (used with permission)


"Early morning photograph of a two-lane suburban road with non-flashing traffic lights"
Figure 2   Photo by Vaughn W. Inman (used with permission)


Key Accomplishments

As the Winston-Salem experience demonstrates, removing signals from late-night/early-morning flashing mode operation effectively improves safety and reduces traffic crashes and their resulting injuries.

Results

The removal of the late-night/early-morning flashing mode from eight urban intersections in Winston-Salem cumulatively reduced total crashes by 30.9 percent, injury crashes by 60.1 percent, and right-angle crashes by 88.8 percent per year.

Contact

Stanley Polanis
Director of Transportation
City of Winston-Salem, NC
336-747-6867
stanp@cityofws.org

Retroreflective Borders on Traffic Signal Backplates

Original publication: Retroreflective Borders on Traffic Signal Backplates – A South Carolina Success Story; FHWA-SA-09-011; 2009(PDF, 377kB)


Red-light running is estimated to cause more than 200,000 crashes, 170,000 injuries, and approximately 900 deaths per year (Source: Federal Highway Administration, Red-Light Running Web Site (2008)). One of the reasons for the high number of crashes is driver inability or failure to see the traffic control device in time to comply. The South Carolina DOT (SCDOT) was concerned about the high number of crashes at some of its urban signalized intersections. It recognized that poor signal visibility can cause crashes. In response, SCDOT installed retroreflective borders on existing signal backplates at three intersections in the Columbia area that were experiencing a high incidence of crashes, many with injuries.

"Closeup photograph of a retroreflective traffic light, showing the signal backplate and the retroreflective border applied to the perimeter of the backplate"
Figure 1   Photo courtesy of KLS (used with permission)


"Photograph of a set of three retroreflective traffic lights across a pole during daylight and another photograph of a different set of three in darkness"
Figure 2   Photos courtesy of South Carolina Department of Transportation (used with permission)


Key Accomplishments

The SCDOT experience demonstrates that low-cost improvements can effectively improve safety and reduce traffic crashes and their resulting injuries.

Results

The retroreflective borders installed at these Columbia signalized intersections cumulatively reduced total crashes by approximately 28.6 percent, injury crashes by 36.7 percent, and late-night/early morning crashes by 49.6 percent per year.

Contact

Joey D. Riddle
SCDOT
RiddleJD@dot.state.sc.us

Enhanced Signs and Markings at Stop Sign-Controlled Intersections

Original publication: Stop Sign-Controlled Intersections: Enhanced Signs and Markings: A Winston-Salem Success Story; FHWA-SA-09-010; 2009 (PDF, 355kB)


Stop signs are the primary form of traffic control at intersections across the United States. However, intersections controlled by stop signs account for one-third of all intersection crashes and more than 40 percent of fatal crashes (Source: Insurance Institute for Highway Safety, Volume 37, No 9, October 26, 2000). The City of Winston-Salem, North Carolina, was concerned about the high number of crashes at some of its intersections controlled by stop signs. It recognized that poor sign visibility and inadequate markings can cause crashes.

The city of Winston-Salem installed additional and larger stop signs, “Stop Ahead” advance traffic control signs, and clearly visible centerline markings and stop bars in various combinations at 16 intersections experiencing a high incidence of crashes, many with injuries.

Key Accomplishments

The Winston-Salem experience demonstrates that low-cost improvements can effectively improve safety and reduce traffic crashes and their resulting injuries and/or fatalities.

"Photograph of a stop sign-controlled intersection after enhancements in Winston-Salem, NC"
Figure 1   Double-yellow centerline and stop bars added to existing (24-inch) stop sign.


Results

The combinations of these enhanced countermeasures installed at the 16 Winston-Salem stop-controlled intersections cumulatively reduced total crashes by approximately 55 percent and total injuries by an average of 70 percent per year.

"Photograph of a second stop sign-controlled intersection after enhancements in Winston-Salem, NC"
Photograph of a second stop sign-controlled intersection after enhancements in Winston-Salem, NC


Contact

Stanley Polanis
Director of Transportation
City of Winston-Salem, NC
336-747-6867
stanp@cityofws.org

Safety Evaluation Group

Original publication: HSIP Noteworthy Practice Series, HSIP Project Evaluation; FHWA-SA-11-02; 2011(PDF, 2.3MB)


In 1999, the North Carolina Department of Transportation (NCDOT) created a permanent group of employees to focus on safety project evaluation. The purpose for the group was to establish a formal project evaluation process to verify the success of the state’s efforts in safety.

In the first four years following its formation, the group established a process for conducting project evaluation and identified what results would be most useful to the field engineers. The group’s initial efforts were more research and technically oriented but, to better serve the needs of the field engineers, the results of the evaluation studies were simplified (the field engineers were most interested in the before and after crash diagrams and changes in crash patterns). Originally, the group conducted about 50 project evaluations a year with one supervisor and six engineers, but now the group completes approximately 200 evaluations a year with reduced staff (one supervisor, four engineers, and one technician).

The safety evaluation group conducts simple before-after studies on all spot safety projects once a minimum of three years of before and after data are available (the same time periods are used for both the before and after periods). For each project, the group prepares an evaluation report including before and after crash type and severity data, collision diagrams, photos, and discussion of the study results. After an evaluation report is completed, it is submitted to the field engineer who originally developed the project to provide feedback on whether the project successfully mitigated the previously identified safety issue. For projects unsuccessfully mitigating the safety issue or resulting in a different crash pattern, the evaluation report provides the field engineer with an opportunity to reassess the conditions and identify a different countermeasure. NCDOT is currently working on developing a process to track projects not successfully mitigating the safety issue they were intended to address.

The evaluation group compiles a spreadsheet of all the completed project evaluation studies. The spreadsheet provides the category of improvement, before and after traffic volumes, location, traffic control, geometry, etc., and provides a link to the detailed evaluation report. The spreadsheet is updated regularly and posted on the NCDOT web site. It can be used by engineers to determine which treatments have worked in the past.

The group also develops crash modification factors (CMF) using the Empirical Bayes (EB) method when enough sample sites and data are available. North Carolina specifically focuses on developing CMFs for countermeasures not already extensively researched.

""Graphic of Before and After Crash Diagrams that shows vehicles' motion and crash data: intersection street names, county name, division number, approach speeds, volume split, and traffic signal type

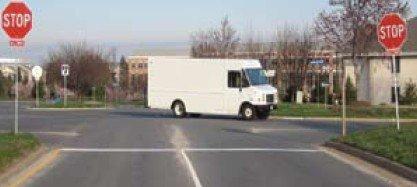
In efforts to promote a particular countermeasure to the field engineers, NCDOT’s evaluation group has also conducted studies on well documented countermeasures to provide evidence of crash reduction effectiveness. One example is the use of four-way stop control. Although several studies document the effectiveness of this countermeasure, many field engineers in North Carolina did not consider it a viable countermeasure. The group evaluated over 50 intersections throughout the State and demonstrated four-way stop controls were effective. Study results were presented to field engineers in an effort to change their perspective. While field engineers were very receptive to the study results, it is too early to determine if it has increased the use of four-way stop control in the State.

Key Accomplishments

  • Established a group focused on safety project evaluation.
  • Promoted the use of effective countermeasures.
  • Provided feedback to engineers on the effectiveness of their individual safety projects and various countermeasures.

Results

Since the establishment of the safety evaluation group, North Carolina has evaluated and documented the results of more than 600 projects. The evaluation reports provide field engineers with valuable feedback on the effectiveness of their safety projects, as well as various countermeasures, and promote the use of effective countermeasures.

Contact

Shawn Troy
North Carolina Department of Transportation
919-773-2897
stroy@ncdot.gov

SHSP/HSIP Alignment

Original publication: SHSP Implementation Process Model, Supplement Number 1 – Case Studies; FHWA-SA-10-025; 2010(PDF, 1MB)


Key Accomplishments

  • Established a strong safety focus in regional DOT offices emphasizing the SHSP.
  • Provided improved guidance on safety project development to local agencies resulting in improved project quality and focus on the most serious hazardous locations.
  • Implemented multiple pedestrian safety projects including countdown pedestrian signals, dynamic speed signs in school areas, pedestrian freeway overpasses, and grade separation of a bike path crossing.

Because the target fatal crash rate had not been achieved on the non-DOT portion of its road network, Michigan recognized that greater focus on local safety projects was needed. The Michigan Department of Transportation (MDOT) has a policy to distribute a cover letter to regional engineers and system managers strongly encouraging submission of safety projects in the annual call for projects. In addition, to provide more focus at the local level, the 2008 call for projects highlighted the need for local safety projects. As part of the process, MDOT delivered presentations on the SHSP at State conferences to increase awareness and alignment of safety projects with the emphasis areas.

In letters to the county road association and municipal league announcing the call for high-risk rural road and local safety projects, MDOT requires benefit/cost or time-to-return analysis on all project submissions for better alignment with the SHSP. To support local agencies in completing this requirement, MDOT provides a listing of accepted crash reduction factors for commonly submitted projects. The letters also promote submission of non-motorized projects, which aligns with the SHSP’s emphasis area on pedestrians and bicycles. To help with identification of high-risk locations, MDOT provides fatal and serious-injury crash maps by region on the Web site. Regional MDOT staff provides assistance to local agencies on project development when requested to make sure safety projects fit into a SHSP focus area.

Results

By providing local agencies more details on the types of safety projects MDOT seeks, the quality of submittals is improving and safety projects are aligning with SHSP emphasis areas.

Contact:
Jim D’Lamater
Safety Engineer
Michigan DOT
517-335-2224
dlamaterj@michigan.gov

Collaborative Problem Solving

Original publication: SHSP Implementation Process Model, Supplement Number 1 – Case Studies; FHWA-SA-10-025; 2010(PDF, 1MB)


Key Accomplishments

  • Built trust and understanding through inter/intraagency communication.
  • Improved data collection and analysis capabilities.
  • Considered safety in a wider range of transportation planning processes.

The process to develop and implement an effective SHSP requires a multidisciplinary approach from the state’s safety stakeholders. Working collaboratively to identify and solve the State’s transportation safety problems is central to the plan’s success.

States demonstrating success with implementation of their SHSPs find collaborative arrangements are the norm and tend to have superior inter/intraagency communication. Partners talk to one another on a frequent basis, building trust and understanding. This collaboration helps expand the SHSP’s reach to the broader safety community, and fosters the mindset that “we all understand what the safety priorities are.”

Collaboration results in wiser use of the State’s limited resources. States have found this approach helps improve their crash data collection and analysis capabilities. Solutions arrived at collaboratively among several agencies and data users result in improved processes and cost sharing. Collaboration on SHSP projects brings new partners to the effort and expands resources to assist with SHSP implementation.

One success story involves a close partnership between the Utah Department of Transportation (UDOT) and Utah Department of Public Safety’s Highway Safety Office (HSO). The HSO includes the UDOT Traffic and Safety Engineer in its annual NHTSA-required Highway Safety Plan process. This relationship is reciprocated by UDOT. UDOT includes the HSO as a partner to use HSIP flexible funds to implement behavioral programs. UDOT also provided a portion of STP Enhancement Funds to the SHSO for education and outreach programs involving pedestrian safety.

The benefits of the SHSP collaborative approach carry over to other projects as well. Personnel involved with the Motor Carrier Safety Assistance Program (MCSAP) are intimately involved in SHSP implementation. As a result, the MCSAP and the SHSP work in concert to address commercial vehicle traffic safety. This collaboration has led to the adoption of new technologies, such as speed detection signs, specifically addressing commercial vehicle safety.

Results

The State’s adoption of a collaborative problem solving approach resulted in improved data collection and analysis capabilities, new interagency collaborations on planning activities, and improved utilization of limited State resources.

Contact:
Robert Hull
Director, Traffic and Safety Division
Utah DOT
801-965-4273
rhull@utah.gov

Ohio Develops Centralized Data Source for All SHSP Partners

Original publication: SHSP Implementation Process Model, Supplement Number 1 – Case Studies; FHWA-SA-10-025; 2010(PDF, 1MB)


Key Accomplishments

  • Developed a centralized data source for all SHSP partners resulting in more consistent safety analysis Statewide.
  • Established common data analysis processes enabling problem identification, tracking, and evaluation to be conducted in a consistent manner across agencies.
  • Improved local agency and MPO safety analysis capabilities by providing user-friendly analysis tools.

The SHSP process requires data from a variety of sources to support the emphasis areas. If a central data source is not available, emphasis area teams may use conflicting data. When the safety data used by multiple agencies is inconsistent, tracking, evaluation, and problem identification are difficult.

To improve data consistency, Ohio created the Crash Statistics System (CSS), a single Statewide crash database for use by all agencies and the public. The CSS is managed by the Department of Public Safety (DPS), which is also responsible for license, citation, and vehicle registration data. The Ohio Enhanced Crash Location and Identification System (OECLIS), managed by the Ohio Department of Transportation (ODOT), uses the latest three years of crash data, which are merged with data on roadway characteristics and then analyzed to identify high-crash intersections and corridors. These databases support development of SHSP strategies and action plans.

A second element developed by ODOT, the GIS Crash Analysis Tool (GCAT), is an on-line GIS Web tool designed to enhance safety analysis capabilities. It allows users to extract crash data spatially and to create tables, charts, graphs, and collision diagrams based on the crash data selected from the map. The Crash Analysis Module (CAM) Tool is an Excel template that was built for the GCAT and helps facilitate common data analyses and queries, including crashes by day-of-week, light condition, weather condition, severity, and road condition.

State and local law enforcement agencies provide funds for data collection. ODOT staff cleans and maintains the data and provides data analysis support for metropolitan planning organizations (MPO) and local agencies. Ohio used §408 funds to develop the CSS portal.

Results

Ohio’s centralized process for safety data distribution has resulted in improved consistency in data analysis among all SHSP partners. Problem identification, tracking, and evaluation of safety progress have improved. The CSS, GCAT, and CAM Tool have increased local government and MPO access to crash data and enabled agencies to easily perform basic crash analyses.

Contact:
Jonathan Hughes, P.E.
Office of Systems Planning and Program Management
Ohio DOT
614-466-4019
jonathan.hughes@dot.state.oh.us