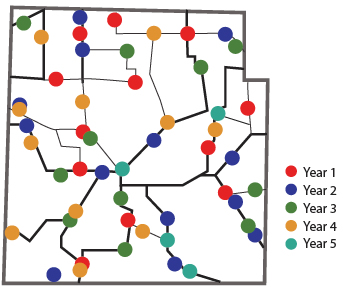
Figure 1. Fatal Crash Locations within
Hypothetical County
FATAL CRASH LOCATIONS

Number and location of fatal crashes
change from year to year.
TOP THREE FATA CRASH TYPES FOR EACH YEAR

Fatal crash types are consistent from
year to year
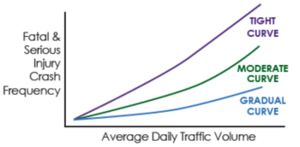
Figure 2. Relationship between Traffic
Volume, Curve Radii, and Fatal and
Serious Injury Crashes

Known roadway factors like high average daily
traffic (ADT) and tight curve radii contribute to
increases in fatal and serious injury crashes. By
targeting locations with known roadway factors,
agencies can focus on treating locations with the
greatest potential for future crashes rather than
the whole system.
Have you ever known of a road segment that warranted improvement but lacked the requisite crash history to acquire funding for needed countermeasures? By using the systemic safety approach, agencies can identify, estimate, and plan for current and future safety concerns without relying on location-specific crash data. This approach allows managers to effectively plan safety improvements and allocate resources proactively rather than waiting for crashes to occur and then reactively responding to public calls for action.
Since severe crashes are random events that rarely occur in the same location twice, it is difficult to predict where the next one will occur. While severe crashes may occur at random locations, severe crash types are predictable, as can be seen in Figure 1. This figures illustrates that the number and location of fatal crashes changes from year to year, while the circumstances that most commonly contribute to severe traffic crashes are consistent over time.
WHAT IS THE SYSTEMIC SAFETY APPROACH?
To understand the concept behind systemic safety, consider the analogy of contracting the flu. A childcare worker has a greater potential of contracting the flu than most people due to her above average exposure to children. The childcare worker can either wait until she contracts the flu to treat the virus or she can proactively get a flu shot. These options represent the thought process behind the reactive method of addressing crashes and the systemic approach to safety, respectively.
In the world of traffic safety, crashes are similar to contracting the flu. The roadway factors associated with fatal and serious injury crashes can be identified and addressed. Roadway factors represent the roadway and traffic characteristics present at locations experiencing higher than expected frequencies of the target crash type. Rather than treating the whole system, you can focus on locations with the highest potential for future crashes.
"We cannot reach zero deaths if we wait for crashes to occur.
The systemic safety approach proactively addresses serious
injuries and fatalities before they occur."
Scott Davis, Thurston County Public Works
CRASH-BASED VS. SYSTEMIC SAFETY ANALYSIS
Systemic safety analysis complements the traditional crash-based analysis. A comprehensive safety management program will include investments to address opportunities identified through both crash-based and systemic safety analysis.
Benefits of the Systemic Approach to Safety
Prevents crashes before they occur.
Rather than waiting for crashes to occur, the systemic approach uses roadway factors to treat potential future crash locations now.
Optimizes safety benefit.
Low-cost systemic improvements can be deployed widely across the system, yielding a greater overall safety benefit.
Leverages in-house resources.
Since systemic improvements are low cost, agencies may already have needed materials in their inventories and can install them using maintenance staff.
Improves future planning.
A better understanding of roadway factors that contribute to crashes will improve future design, operations, and maintenance practices.
Systemic Safety Approach In Practice
A roadway departure crash caught the attention of the media when a school bus overturned at a horizontal curve. Elected officials pressured the DOT to ensure that this would not happen again. The agency contemplated two responses: (1) use a large portion of their safety funds to straighten the single curve, or (2) identify many curves with similar roadway factors and apply low-cost treatments (i.e., tree trimming, chevrons, delineators).
The agency examined all school bus routes and observed the following roadway factors that could contribute to crashes:
The agency could treat one high-cost curve
location for $500,000, or it could treat 20 locations
with low-cost countermeasures for an average
cost of $25,000 per project. By treating numerous
high-risk locations, the agency will reduce more
fatal and serious injury crashes, yielding a greater
benefit-to-cost ratio.
- Large changes in grade.
- Sharp curves with advisory speeds less than 35 miles per hour.
- Poor/limited sight distance.
- Frequency of pick-up and drop off points.
- Narrow lanes (10 ft. or less) with little to no shoulder.
The agency used this list to identify 20 locations that exhibited three or more of these characteristics. By treating numerous locations, the agency estimated that the combined safety benefit will be greater than if they applied a higher cost treatment at a single location.
For more information on the systemic approach to safety, visit /safety/safety-data-analysis-tools/systemic
For additional
information,
please contact:
Jerry Roche
FHWA Office of Safety
515.233.7323
Jerry.Roche@dot.gov
John McFadden
FHWA Resource Center
410.962.0982
John.McFadden@dot.gov
Every Day Counts (EDC), a State-based initiative of FHWA's Center for Accelerating Innovation, works with State, local and private sector partners to encourage the adoption of proven technologies and innovations aimed at shortening and enhancing project delivery.
