USA Banner

Official US Government Icon

Official websites use .gov
A .gov website belongs to an official government organization in the United States.

Secure Site Icon

Secure .gov websites use HTTPS
A lock ( ) or https:// means you’ve safely connected to the .gov website. Share sensitive information only on official, secure websites.

U.S. Department of Transportation U.S. Department of Transportation Icon United States Department of Transportation United States Department of Transportation

Noteworthy Practices

Illinois Safety Portal Makes Key Data Easily Available to Safety Stakeholders


Describe the roadway safety situation or state before the new practice was implemented. What was the safety issue, problem, or gap?

For years, Illinois county engineers wanted access to crash reports for their studies. State legislation was changed to include local governmental agencies, but they still had to sign an inter-governmental agreement with the Illinois Department of Transportation (IDOT) to receive the reports.

What were the key challenges that needed to be addressed before the new practice could be implemented?

The existing legislation 625 ILCS 5/11-408 of the Illinois Vehicle Code states:

“Upon request, the Department (IDOT) shall furnish copies of its written accident reports to Federal, State, and local agencies that are engaged in highway safety research and studies. The reports shall be for the privileged use of the Federal, State, and local agencies receiving the reports and shall be held confidential.”

As a result, the inter-governmental agreement was required to access the data.

Describe the new practice.

The Safety Portal was developed and launched in August 2014 to allow Illinois local government entities to view their crash reports. This project includes various tools that provide crash report(s) search capabilities, Geographic Information Systems (GIS) mapping for identified crash reports, on-line training materials for law enforcement agencies, and predefined crash data summary reports. The target end users for the Safety Portal include IDOT staff; National Highway Traffic Safety Administration (NHTSA) representatives; Federal Highway Administration (FHWA) representatives; Federal Motor Carrier Safety Administration (FMCSA) representatives; Illinois County Engineers and staff; Metropolitan Planning Organizations in Illinois; and state, county, and local law enforcement agencies.

The Safety Portal is one place all these entities can now view Illinois crash reports and data summaries without signing agreements with IDOT. End users do, however, have to agree to comply with a Confidentiality Statement before they can gain access to the Safety Portal. For end users to gain access to the Safety Portal, they must be approved by a “Vetter.” Vetters are people who have the authority to approve individuals from their respective agencies/jurisdictions for access into the Safety Portal.

List the key accomplishments that resulted from the new practice. Include the roadway safety improvements.

  • As of the beginning of calendar year 2015, IDOT had received 599 Vetter Registration forms from law enforcement agencies, county highway departments, IDOT, FHWA, and FMCSA.
  • A total of 520 users were registered and approved for access to the Safety Portal. Of those, 85 are with IDOT, 351 are with law enforcement agencies, 81 are with county engineers, 2 are from the FHWA, and 1 is from the FMCSA.
  • As of April 3, 2015, there are 869 registered end users. This number continues to climb each week.

What technical and/or institutional changes resulted from the new practice?

The Safety Portal allows users to obtain important crash information. The tool eliminated the need for agencies to sign inter-governmental agreements.

What benefits were realized as a result of the practice?

  • The former Chairman of the County Engineers Safety Committee indicated their membership feels the Safety Portal is an excellent tool that advances their ability to access critical data and crash reports for their counties. They are excited to have all 102 of their Association members registered, along with their respective staff.
  • IDOT has also received feedback from local Chiefs of Police indicating this tool will be invaluable for their search of historical records. One Chief commented that now he will not have to dig through old filing cabinets to find crash reports from three to five years ago, instead he has simple access to them through the Safety Portal.

Contact

Jessica Keldermans
DTS—Bureau of Safety Data & Data Services
Bureau Chief
(217) 785-3062
Jessica.Keldermans@illinois.gov
www.idot.illinois.gov

Washington State DOT Implements $26 Million in Local Roadway Safety Improvements through Local Agencies


Describe the roadway safety situation or state before the new practice was implemented. What was the safety issue, problem, or gap?

Highway Safety Improvement Program (HSIP) funds in Washington State are divided between State highways and local agency roadways. The funds are split according to the top priority infrastructure emphasis areas from the State Strategic Highway Safety Plan (SHSP): Target Zero. The top priority, or priority 1, emphasis areas are run-off-road crashes and intersection-related crashes. The split between State and local share of those crashes has remained very consistent at roughly 30 percent on State maintained roadways and 70 percent local agency responsibility. Therefore, 70 percent of HSIP funds are provided to local agencies through programs administered by the Local Programs division of the Washington State Department of Transportation (WSDOT).

From 2010 to 2014, county roads accounted for 25 percent (2,801 of 11,259) of all fatal and serious injury crashes in Washington State. However, those crashes are spread out over more than 39,000 miles of road. Very few locations have more than one fatal or serious injury crash over a five-year period. This seemingly random pattern makes implementation of safety countermeasures more challenging.

Since 2009, counties applying for HSIP funds have been required to implement low-cost improvements over widespread areas of their network. Projects have been awarded to all 39 counties statewide in that time period. Counties are allowed to identify which countermeasures they implement and where they are implemented, as long as they address fatal and serious injury crash types (primarily run-off-the-road) using proven countermeasures. Counties are responsible for identifying priority locations using this risk-based approach to safety.

What were the key challenges that needed to be addressed before the new practice could be implemented?

Counties had to be provided with the resources to develop local road safety plans to identify locations and priorities for road safety projects. The resources included statistical summaries, development of workshops, and coordination of training through the Federal Highway Administration's (FHWA) Data and Analysis Technical Assistance program.

Describe the new practice.

Counties are required to develop a local road safety plan to identify locations and priorities. The development of such a plan is required in order for a county to be eligible to apply for HSIP funds. WSDOT assisted the counties with the development of local road safety plans in the following manner:

  • Counties were provided with summary data to help them prioritize crash types, roadway characteristics, and conditions more prevalent in fatal and serious injury crashes.
  • A series of eight workshops were held around the state for counties to better understand the requirements of the local road safety plan. These workshops helped to emphasize no new data are needed to be collected to develop a local road safety plan.
  • During the workshops, counties were provided with additional resources, such as the Systemic Safety Project Selection Tool and the SHSP recommended countermeasures.
  • After the workshops, training specific to the Systemic Safety Project Selection Tool was made available to counties (and a few interested cities).
  • Technical assistance was provided as needed for any county requesting assistance in development or review of their local road safety plans and HSIP applications.
  • For the final application for HSIP funds, counties were required to develop a list of prioritized projects, each with a separate cost estimate.
  • If counties could advertise new safety projects by September 30, 2016, the state would provide the 10 percent match typically required from the local agency, allowing the counties to receive 100 percent funding for construction.

List the key accomplishments that resulted from the new practice. Include the roadway safety improvements.

  • The majority of counties completed a local road safety plan and applied for funds within a five-month window from the announcement of the program to the application deadline.
  • Of those that applied, 30 counties received funding for a total of $26.5 million in improvements.
  • Nearly every project, in every county, committed to meeting that deadline in order to receive 100 percent construction funding support.

What technical and/or institutional changes resulted from the new practice?

The development of local road safety plans has a high potential to reduce fatal and serious injury crashes on the county road network. This approach is data-driven, creates a process to determine risks across the network, and provides the flexibility to select the most cost-effective projects. This approach is also changing the safety culture among counties across the state by making them evaluate their roads in a different way than before.

What benefits were realized as a result of the practice?

  • Two key partnership opportunities also emerged from this process including the Washington State Association of Counties (the state's NACE-affiliate) and the County Road Administration (CRAB).
  • CRAB received a Traffic Records Committee grant to develop a safety module that works with their existing database. This will allow counties to combine crash, roadway, and volume data to develop a systemic safety program. The module will help to implement the Systemic Safety Project Selection Tool analysis process.

"photo of the installed bridge guard rail"

Bridge guard rail installation as a result of a local road safety plan

"photo of updated signs on a roadway that curves ahead"

Signage updates as a result of a local road safety plan

Contacts

Matthew Enders, PE
Manager, Technical Services
(360) 705-6907
EndersM@wsdot.wa.gov

Susan Bowe, PE
Traffic Services Manager
(360) 705-7380
BoweS@wsdot.wa.gov

Florida DOT Develops Comprehensive Coalition to Address and Assist Aging Drivers


Describe the roadway safety situation or state before the new practice was implemented. What was the safety issue, problem, or gap?

Today's older adults are not only living longer; they are continuing to drive longer than any generation in history. Research suggests older adults can expect to outlive their ability to drive safely by seven to ten years. Florida has a significant number of aging road users with 18.2 percent of its population over age 65. This percentage is expected to grow to 27 percent by 2030, a figure substantially higher than the national average of 19.7 percent.

As an increasing number of older adults drive on Florida's roadways or travel the roads as pedestrians, passengers, bicyclists, motorcyclists, or transit riders, the issue of transportation safety becomes a greater public health concern. In 2013, there were 454 fatalities involving drivers age 65 and older, which is over 19 percent of all fatalities.

What were the key challenges that needed to be addressed before the new practice could be implemented?

The Florida Department of Transportation (FDOT) created a Safe Mobility for Life Program within its Traffic Engineering and Operations Office which quickly expanded as an increasing number of stakeholders became involved with the program. The program originally focused on engineering improvements on the state highway system to compensate for the natural changes that occur as people age. Human factors studies were soon incorporated into the program, in conjunction with the Florida State University Department of Psychology, to gain a better understanding of how traffic control devices are comprehended by all age groups prior to implementation. A training course was later developed and tailored to the Federal Highway Administration's (FHWA) Highway Design Handbook for Older Drivers and Pedestrians to address the unique aspects of Florida's transportation system and take into account competing design practices such as Context Sensitive Design/Solutions and Livable Communities. With an ever increasing number of activities associated with the program, FDOT needed to develop a better solution to integrate its various partners into the program.

Describe the new practice.

FDOT partnered with the Pepper Institute on Aging and Public Policy at Florida State University to form a statewide coalition. The Safe Mobility for Life Coalition (SMFLC) consists of 27 agencies and organizations who share responsibilities and interests in aging road user safety and mobility.

Activities developed or supported by the Coalition that have helped Florida achieve reductions in aging road user traffic related fatalities and serious injuries include:

  • Roadway and Pedestrian Improvements: Safety countermeasures including larger lettering on signs, advance warning signs, countdown pedestrian signals, etc.
  • Dedicated website (safemobilityfl.com): A one-stop website created and maintained by FDOT to put aging road user transportation safety and mobility tools and resources all in one place.
  • Florida's Guide for Aging Drivers: This free guide was developed as a printed version of the FLsams website and is designed to help Floridians learn how to continue to safely drive while also sharing information to help prepare and plan ahead to meet their mobility needs after transitioning from driving.
  • Find-a-Ride Database: This database, generated by the University of Florida, provides direct access to over 800 local transportation options through the Find-a-Ride page on the FLsams website.
  • Aging Road User Survey: This survey conducted in September 2012 and again in 2013 saw an increase in the number of people who had heard about SMFLC as well as an increase in the number of individuals who indicated they were preparing for when they could no longer drive.
  • Safe Mobility for Life Resource Center: Coalition materials that promote and educate on aging road user safety and mobility are distributed upon request to all stakeholders, including the guide, checklist, brochures, and tip cards that support the Aging Road User Strategic Safety Plan.

List the key accomplishments that resulted from the new practice. Include the roadway safety improvements.

  • The proportion of traffic fatalities in Florida involving drivers ages 65-74 was below the proportion for both the NHTSA Region 4 and the nation during the last three years (2011-2013).
  • Broadcasted three focus group tested radio public service announcements targeting urban and rural priority counties in 2014.
  • Conducted an Assessment of Health Care Providers and Older Adult Service Organizations research project with results used to develop and distribute educational materials and resources.

What technical and/or institutional changes resulted from the new practice?

The Coalition developed the Aging Road User Strategic Safety Plan, which is incorporated in Florida's Strategic Highway Safety Plan under the At-Risk Drivers Emphasis Area. The Aging Road User Strategic Safety Plan is broken down into 10 key emphasis areas:

  • Advocacy and Policy;
  • Aging in Place;
  • Assessment, Remediation, and Rehabilitation;
  • Data Collection and Analysis;
  • Licensing and Enforcement;
  • Other Road Users;
  • Outreach and Education;
  • Prevention and Early Recognition;
  • Program Management, Evaluation, and Resources; and
  • Transitioning from Driving.

The plan includes specific emphasis areas and tracks their progress and implementation to ensure that the overall plan is moving forward.

What benefits were realized as a result of the practice?

  • Developed specialized materials that focus on older driver related transportation safety issues.
  • Held special events including: an indoor/outdoor interactive Safety is Golden Mobility Fair to provide available local transportation safety and mobility resources to participants; a Transit is Golden safety event to help educate and promote the use of public transportation among older adults by walking to a bus stop and traveling to a local destination; and a Stop on Red safety event in collaboration with Alert Today Florida to promote pedestrian safety.
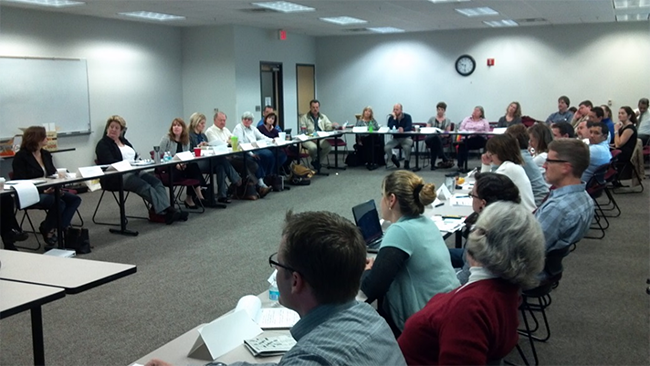
"photo of the quarterly meeting members sitting at tables arranged in a 'U' shape"
Safe Mobility for Life Coalition members attend quarterly meeting in Tallahassee, FL


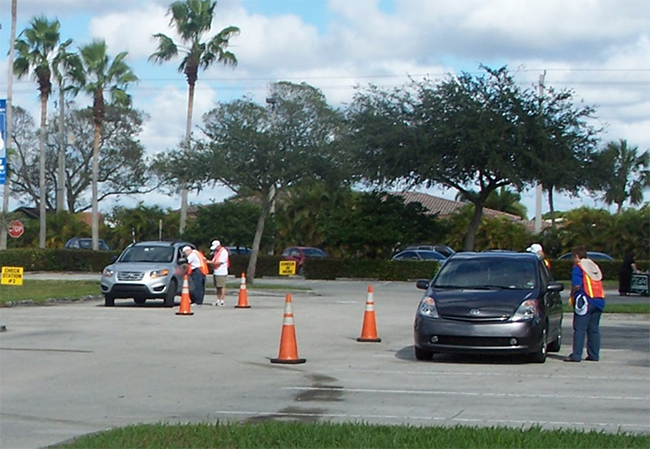
"photo of a CarFit event"
Members working as trained technicians at a CarFit event in Tamarac, FL


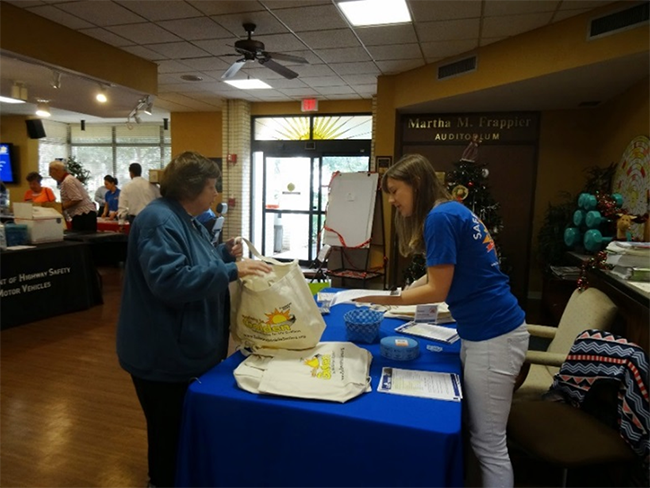
"photo at an information booth at the fair"
Distributing safety information at the Safety is Golden Mobility Fair in St. Petersburg, FL


Contacts

Safe Mobility for Life Program
Florida Department of Transportation
State Traffic Engineering and Operations Office
605 Suwannee Street, MS 36
Tallahassee, Florida 32399-0450
Gail.Holley@dot.state.fl.us
850-410-5414

Pepper Institute on Aging and Public Policy
Safe Mobility for Life Resource Center
636 West Call Street
Tallahassee, FL 32306
Safe-Mobility-For-Life@fsu.edu
850-644-8145

Michigan DOT Reduces Crashes by 47 Percent by Implementing a Centerline Rumble Strip Initiative


What was the safety issue, problem, or gap?

From 2004-2007, lane departure crashes accounted for 17.2 percent of all crashes in Michigan, but 47.4 percent of all fatal crashes. Michigan Department of Transportation (MDOT) recognized that while the type and severity of the crashes had similarities, the location at which they occur is random. As a result, MDOT began a three-year statewide initiative in 2008 to install milled centerline rumble strips on all rural non-freeway highways with a posted speed limit of 55 mph, eventually including approximately 5,400 miles of non-freeway roadways. MDOT also installed shoulder rumble strips (SRS) on roadways with paved shoulders of at least 6 feet in width. This systemic initiative is to date the largest of its kind in the United States and provided a unique study opportunity. Consequently, MDOT wished to evaluate the impacts of these rumble strip installations on traffic safety and operation and pavement durability to provide guidance for future implementation both in Michigan and in other states. This evaluation study primarily focused on safety effectiveness of centerline rumble strips (CLRS), since the effectiveness of SRS had previously been established through numerous nationwide research and studies.

What were the key challenges that needed to be addressed before the new practice could be implemented?

  • MDOT had to ensure that stakeholders were involved in the process and developed and circulated survey to capture the opinions and input of various road users.
  • Additionally, MDOT developed a pair of rumble strip-based public service announcements for outreach.
  • The installation of the rumble strips needed to be expedited in order to ensure valid research results.

Describe the new practice.

  • Centerline rumble strips are a set of transverse grooves applied on the centerline of a roadway to alert inattentive (distracted, drowsy, unfocused, etc.) drivers who may unintentionally drift over the centerline.
  • Rumble strips provide a tactile and audible warning to alert drivers.
  • In 2008 MDOT began a three-year statewide CLRS installation initiative, including approximately 5,400 miles of 55 mph, non-freeway roadways over the three-year installation period.
  • To efficiently roll out the rumble strip installations, the contracting process was streamlined by adding the work items to MDOT's annual pavement marking contracts with the direction to cut the rumble strips ahead of restriping the roadways.
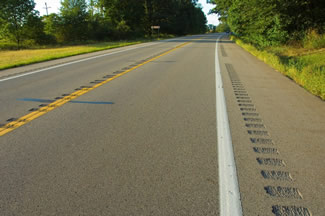
"photograph of a road with non-freeway shoulder and centerline rumble strip installation"
Non-Freeway Shoulder and Centerline Rumble Strip Installation – M-66 in Calhoun County, Michigan


Key accomplishments, including roadway safety improvements.

  • 47 percent reduction in total target crashes (head-on, sideswipe opposite and run-off-the-road left) and a 51 percent reduction in target fatal crashes, as well as reductions in other injuries
  • Economic analysis resulted in a benefit-cost ratio in the range of 58:1 to 18:1 based on discount rate assumptions of 2 percent and 10 percent, respectively
  • A road user survey indicated strong agreement among the respondents that CLRS are a beneficial safety improvement program

What technical and/or institutional changes resulted from the new practice?

  • As a result of the initiative's success, installation of CLRS has become standard practice on trunkline routes in Michigan.
  • Language in MDOT's Road Design Manual now dictates that CLRS be installed on all 55 mph 2- and 4-lane highways (regardless of whether a section is a passing or non-passing zone) where the lane plus paved shoulder width beyond the rumble strip exceeds 13' in width, with exceptions for high driveway densities and the presence of horse drawn buggies.

What benefits were realized as a result of the practice?

  • Rumble strips on high-speed non-freeway highways improved driver performance in most traffic scenarios.
  • CLRS did not contribute to short-term transverse cracking in asphalt pavements.

Contact

Mary Bramble
517-335-2837
BrambleM1@michigan.gov

Arkansas State Highway and Transportation Department Reduces Wet Pavement Crashes by 93 Percent through Pavement Surface Treatments


What was the safety issue, problem, or gap?

Approximately 17 percent of all crashes from 2009 through 2011 that have occurred on Arkansas' highways were on wet pavement, resulting in 160 fatalities, or about 53 fatalities per year. One factor is the pavement, or more appropriately, the pavement texture. It can also have an impact on the ability of a vehicle, even with poor condition tires, to maintain contact with the surface, and the ability of the driver to maintain control of his or her vehicle. Of the 160 wet-weather fatalities that occurred from 2009 through 2011, 28 occurred on Arkansas' Interstates, or about 9 fatalities per year.

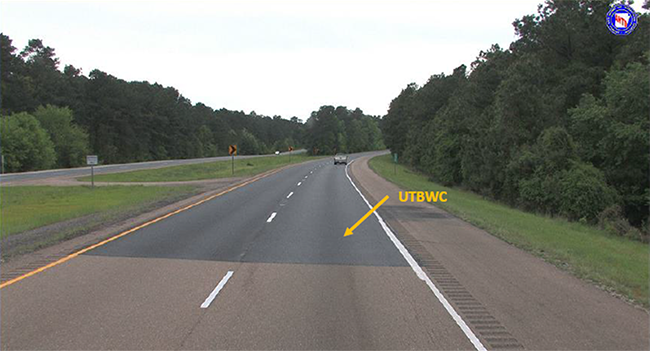
Arkansas made a previous effort to address roadway departure wet-weather crashes. The State identified several locations on the Interstate system with a high percentage of crashes due to wet pavement. Job 070322, Highway 51-Highway 182 Safety Improvements (S), was awarded in July 2008 and completed in November 2008. The purpose of this project was to overlay approximately four miles of Interstate 30 in Clark County. This project consisted of ultrathin bonded wearing course (UTBWC), cold milling, pavement marking, maintenance of traffic, and other miscellaneous items.

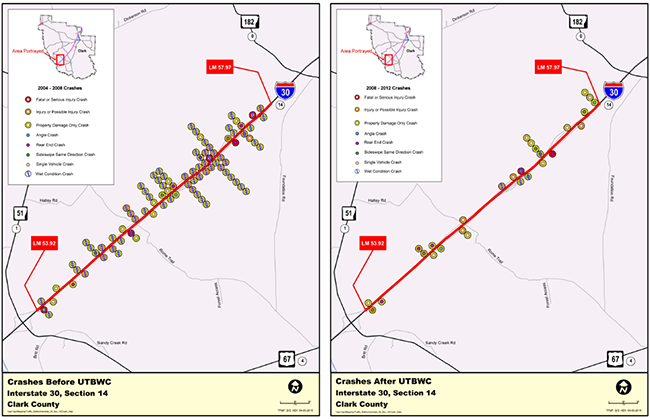
A before-after analysis was conducted within the job limits. In the 48 months prior to the improvement (November 1, 2004 to October 31, 2008), a total of 70 crashes due to wet pavement were observed. In the following 48 months after the project's substantial completion (November 1, 2008 to October 31, 2012), only 5 crashes occurred due to wet pavement. This is a significant reduction of about 93 percent. The benefit-cost ratio for this project is 2.98. Based on a literature review, this is similar to the results experienced in other states.

Describe the new practice.

Based on the previous success of the project on Interstate 30, the Arkansas Highway Commission passed Minute Order 2013-043 in April 2013. This Minute Order authorized the Department to proceed with pavement texture improvement projects to address wet pavement crashes on Arkansas Interstates. Six Interstate locations have been identified for possible UTBWC installation where a reconstruction project is not scheduled for construction within the next four years. Other treatment methods to improve pavement texture may be employed as well. Each of these locations has a high percentage of wet-weather crashes over the last three years.

Arkansas Highway Commission has authorized the Department to proceed with pavement texture improvement projects to address roadway departure wet-weather crashes on Arkansas Interstates.

The general key phases to the implementation of the UTBWC include:

  • Cold milling,
  • Pavement marking,
  • Maintenance of traffic, and
  • Other miscellaneous items.

List the key accomplishments that resulted from the new practice. Include the roadway safety improvements.

Installation of UTBWC has proven to be an effective low-cost countermeasure to improve skid resistance and reduce hydroplaning potential. In addition to the safety benefits, UTBWC preserves the existing pavement and improves user comfort. Due to the treatment's success, the Arkansas Highway Commission has authorized the Department to proceed with pavement texture improvement projects to address roadway departure wet-weather crashes on Arkansas Interstates. Six other locations with a high percentage of wet-weather crashes between 2009 and 2011 were identified. Addressing these locations with UTBWC will help reduce wet-weather roadway departure crashes, helping the Arkansas Highway State Transit Department fulfill its mission statement and strategic goals, and help Arkansas get one step closer Toward Zero Deaths.

What benefits were realized as a result of the practice?

  • Significant reduction in wet weather crashes.
  • UTBWC preserves the existing pavement and improves user comfort.

Further Reading

  • Brewer,A., & D. Nilles. Improving Interstate Safety with Pavement Surface Treatments. Arkansas Highways Magazine, July, 2013. Pages 10-11.
  • Oman, N. I-30 job targets rain-tied crashes Accidents drop in resurface test. Arkansas Democrat-Gazette. Front Section. Page 1.

"photograph of a section of Interstate 30 Westbound that has been overlaid with UTBWC"

Figure 1. Interstate 30 Westbound (Log mile 58.00) in Clark County

Study Area Crash Map

"crash maps of a section of Interstate 30 Westbound that are marked with crash locations before and after UTBWC treatment. The maps show that the total number of crashes is markedly down after treatment."

Figure 2. Study area crash map with before treatment crashes on left and after treatment crashes on right.

Signage Updates Reduce Fatal Crashes in Popular Tourist/Foreign Driver Location near the Grand Canyon in Arizona


What was the safety issue, problem, or gap?

Diamond Bar Road in Mohave County, Arizona provides public road access to Grand Canyon West, site of the internationally renowned Grand Canyon Skywalk on the Hualapai Indian Reservation, attracting approximately 700,000 visitors annually. Subsequent to Diamond Bar Road reconstruction by the Hualapai Tribe and Bureau of Indian Affairs, two (2) fatal, head-on crashes occurred on the facility, approximately 0.7 miles from its intersection with Pierce Ferry Road, which provides access to U.S. 93 and Interstate 40 servicing Grand Canyon West visitor traffic. Each crash involved unimpaired drivers from Ireland and Australia who encroached into the opposing lane of travel upon negotiating the first horizontal curve encountered on Diamond Bar Road.

What were the key challenges that needed to be addressed before the new practice could be implemented?

The key factors focused on identifying the unique driver experiences relating to the crashes and crash circumstances including:

  • Inexperience in driving United States roads with oncoming traffic passing on the driver's side, and
  • Driver behavior as a tourist subject to acute distractions such as scenery, communication with other vehicle occupants, and/or reading directions/maps.

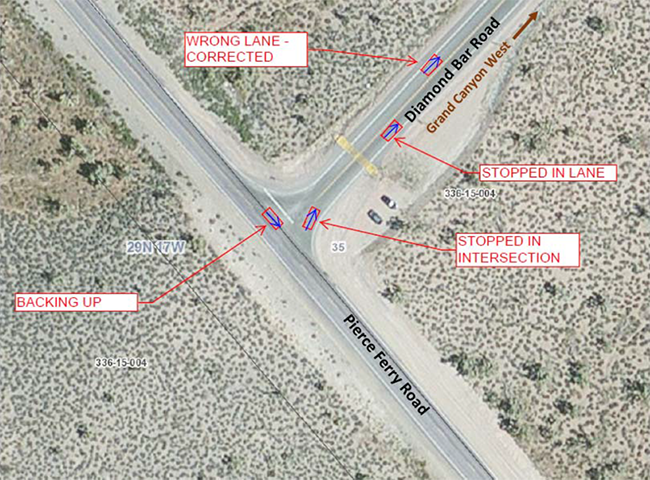
The County's Engineering Division performed a detailed field investigation and traffic engineering report based on intensive two-day observations of inbound tourist traffic to Grand Canyon West during the active holiday season. It found—in seven hours' time over two morning ingress periods—30 separate instances of drivers stopping in the road, backing, making a U-turn, or turning/entering into the opposite lane of travel before immediately correcting. Figure 1 indicates example traffic maneuvers witnessed during the investigation.

"satellite image of the intersection labeled with observed, unsafe traffic manuevers"

Figure 1. Example Vehicle Maneuvers Substantiating Tourist Driver Behavior

Describe the new practice.

The Mohave County Traffic Safety Committee reviewed and endorsed the traffic engineering study findings and recommendations, and the County subsequently installed the following devices in January 2013:

  • An oversize 48” x 48” W6-3 Two-Way Traffic Warning Sign installed on both sides of Diamond Bar Road facing traffic entering Diamond Bar Road.
  • A white thermoplastic through arrow in both Diamond Bar Road travel lanes adjacent the warning signs.
  • Total expense including material and labor costs at the County's burdened rate is $871.00.

Key accomplishments, including roadway safety improvements

January 2015 marks two full years Mohave County has maintained its Wrong-Way Driver Warning Devices. Its success is attributed to zero crashes post-improvement throughout the 14-mile Diamond Bar Road relative to crash type and crash causal factors attributed to the two fatal crashes prompting this Mohave County safety project.

What benefits were realized as a result of the practice?

The devices take a low-tech form but directly address human factors based needs identified in the County's traffic engineering study driving device identification and implementation.

Contact

Michael P. Hendrix, P.E., County Administrator
3715 Sunshine Dr.
Kingman, AZ 86409
928-757-0910

Washington Builds Evaluation into its Strategic Highway Safety Plan

The Washington practice is discussed after the following introduction about Strategic Highway Safety Plan (SHSP) evaluation.

Other states in this SHSP Evaluation Noteworthy Practices series: ID and NV


Planning for Evaluation Should Begin When the SHSP is Developed

The Highway Safety Improvement Program (HSIP) requires States to evaluate their Strategic Highway Safety Plan (SHSP) to ensure the accuracy of their SHSP priorities and proposed strategies. Furthermore, evaluation helps States answer basic questions about the progress of their SHSP such as:

  • What are we trying to do?
  • How well are we doing it?
  • How can we improve?

States that have successfully integrated evaluation into their SHSP process have realized the opportunity it provides to strengthen their SHSP efforts. Benefits include demonstrating the SHSP's contribution to transportation safety; uncovering challenges in prioritizing or implementing programs and strategies; determining progress in meeting SHSP goals and objectives, and; validating emphasis areas and strategies, or revealing the need to revise them.

Following are examples of how States have put evaluation into action.

  • Outcome performance measures: how they will measure progress towards their goals and objectives.
  • Priority strategies: those evidence-based or promising strategies that have the greatest potential to help them reach the emphasis area goals and objectives.
  • Output performance measures: activity measures that help document program implementation.

It is never too early to institute evaluation; in fact, planning for evaluation should begin when the SHSP is developed. During the early stages of SHSP development attention should be given to how progress will be measured and success determined.


Washington's Practice

Washington Develops an Evaluation Plan

Washington State has developed an evaluation plan for their 2013-2016 SHSP, which they call Target Zero.

In their Target Zero plan, Washington documented how they intended to develop an evaluation plan to guide their SHSP evaluation. Early in 2014, representatives from the Washington State Department of Transportation (WSDOT) and the Washington Traffic Safety Commission (WTSC) convened to determine how to facilitate the overall SHSP evaluation.

FHWA's assistance in creating the framework for evaluating our SHSP has been central to getting that work off the ground. We've discussed evaluation as a priority but weren't able to make it happen until FHWA offered their expertise and technical tools. Our partnership with FHWA has helped jumpstart a meaningful evaluation of our SHSP.”

- Chris Madill, Deputy Director
Washington Traffic Safety Commission

Washington decided it would conduct a performance evaluation to determine how effective the SHSP has been in meeting its goals and objectives (outcomes), and the status of the implementation of their SHSP strategies (outputs). The evaluation plan captures these elements, which track back to their SHSP:

  • Goal(s) and objectives
  • Outcome performance measures: how they will measure progress towards their goals and objectives
  • Priority strategies: those evidence-based or promising strategies that have the greatest potential to help them reach the emphasis area goals and objectives
  • Output performance measures: activity measures that help document program implementation
  • Tracking and data needs: the data they need to track the strategies and who will be responsible for coordinating this data

Washington also uses a tracking tool to record progress in meeting their goals and objectives and the status of their implementation activities.

Washington plans to use their evaluation results to help guide the development of their SHSP update, particularly the strategies in the next plan. It will also use the results to provide updates to partners such as National Highway Traffic Safety Administration (NHTSA) and Governors Highway Safety Association (GHSA), to inform leadership on key initiatives, and inform the Governor's office and legislators.

Figure 1. Washington SHSP Implementation and Output Tracking Tool

"screenshot from 11/25/2014 of a Run-Off-The-Road page from the Washington SHSP Implementation and Output Tracking Tool"

See these other SHSP Evaluation Noteworthy Practices:

Contact

Chris Madill
Deputy Director
Washington Traffic Safety Commission
(360) 725-9884
wtsc.wa.gov

Idaho Builds Evaluation into its Strategic Highway Safety Plan

The Idaho practice is discussed after the following introduction about Strategic Highway Safety Plan (SHSP) evaluation.

Other states in this SHSP Evaluation Noteworthy Practices series: NV and WA


Planning for Evaluation Should Begin When the SHSP is Developed

The Highway Safety Improvement Program (HSIP) requires States to evaluate their Strategic Highway Safety Plan (SHSP) to ensure the accuracy of their SHSP priorities and proposed strategies. Furthermore, evaluation helps States answer basic questions about the progress of their SHSP such as:

  • What are we trying to do?
  • How well are we doing it?
  • How can we improve?

States that have successfully integrated evaluation into their SHSP process have realized the opportunity it provides to strengthen their SHSP efforts. Benefits include demonstrating the SHSP's contribution to transportation safety; uncovering challenges in prioritizing or implementing programs and strategies; determining progress in meeting SHSP goals and objectives, and; validating emphasis areas and strategies, or revealing the need to revise them.

Following are examples of how States have put evaluation into action.

  • Outcome performance measures: how they will measure progress towards their goals and objectives.
  • Priority strategies: those evidence-based or promising strategies that have the greatest potential to help them reach the emphasis area goals and objectives.
  • Output performance measures: activity measures that help document program implementation.

It is never too early to institute evaluation; in fact, planning for evaluation should begin when the SHSP is developed. During the early stages of SHSP development attention should be given to how progress will be measured and success determined.


Idaho's Practice

Idaho Develops an Evaluation Plan

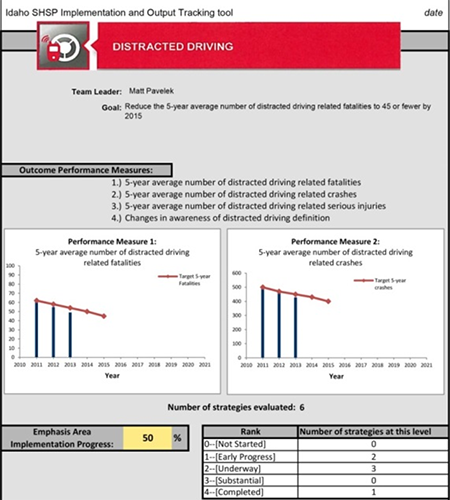
Recognizing the importance of SHSP evaluation, Idaho embarked on the development of an evaluation plan in the early stages of their 2013-2016 SHSP. To develop the evaluation approach, the Idaho Transportation Department (ITD) convened a two-day workshop that included the input of Focus Group Committee Chairs, the SHSP Executive Oversight Team, the Office of Highway Safety Manager, the SHSP Manager, and FHWA. During the workshop, the evaluation team identified performance measures for emphasis area goals and objectives as well as for priority strategies. The team determined the data they would need to monitor their progress, established a tracking tool, and assigned roles and responsibilities for the various evaluation components. These elements are captured in an evaluation plan document that the team will continue to reference over the life of their SHSP.

The Focus Group Chairs are taking the lead on tracking SHSP implementation and monitoring progress towards goals and objectives. Their tracking tool generates a summary sheet, which is used to inform leadership and to report on their progress at their regular SHSP team and committee meetings.

In general, their evaluation results are used to monitor progress and identify areas of success as well as those needing improvement. Modifications will be made as warranted.

Results are also used to:

  • Inform leadership, such as for the annual report out on the highway safety program
  • Inform and involve SHSP oversight team
  • Make “course corrections” to strategies or strategy implementation (if warranted)
  • Help orient new SHSP members

Figure 1. Idaho SHSP Implementation and Output Tracking Tool

"screenshot of a Distracted Driving page from the Idaho SHSP Implementation and Output Tracking Tool"

See these other SHSP Evaluation Noteworthy Practices:

Contact

Lisa Losness
Office of Highway Safety
Idaho Transportation Department
Lisa.Losness@itd.idaho.gov

Nevada Builds Evaluation into its Strategic Highway Safety Plan

The Nevada practice is discussed after the following introduction about Strategic Highway Safety Plan (SHSP) evaluation.

Other states in this SHSP Evaluation Noteworthy Practices series: ID and WA


Planning for Evaluation Should Begin When the SHSP is Developed

The Highway Safety Improvement Program (HSIP) requires States to evaluate their Strategic Highway Safety Plan (SHSP) to ensure the accuracy of their SHSP priorities and proposed strategies. Furthermore, evaluation helps States answer basic questions about the progress of their SHSP such as:

  • What are we trying to do?
  • How well are we doing it?
  • How can we improve?

States that have successfully integrated evaluation into their SHSP process have realized the opportunity it provides to strengthen their SHSP efforts. Benefits include demonstrating the SHSP's contribution to transportation safety; uncovering challenges in prioritizing or implementing programs and strategies; determining progress in meeting SHSP goals and objectives, and; validating emphasis areas and strategies, or revealing the need to revise them.

Following are examples of how States have put evaluation into action.

  • Outcome performance measures: how they will measure progress towards their goals and objectives.
  • Priority strategies: those evidence-based or promising strategies that have the greatest potential to help them reach the emphasis area goals and objectives.
  • Output performance measures: activity measures that help document program implementation.

It is never too early to institute evaluation; in fact, planning for evaluation should begin when the SHSP is developed. During the early stages of SHSP development attention should be given to how progress will be measured and success determined.


Nevada's Practice

SHSP Annual Report Helps Nevada Monitor Performance Measures Progress

Implementation Status for Strategy:
Enforce pedestrian laws at high crash locations;
pursue judicial follow through.

  • Funding secured from a Nevada Joining Forces grant to augment enforcement related to pedestrian safety and speed.
  • Courts were briefed on potential changes in the law to improve pedestrian safety. [Update! Nevada was successful in changing laws to improve pedestrian safety in the 2015 legislative session, which was due to the efforts of the Pedestrian Critical Emphasis Area and Pedestrian Task force. These laws included the use of “Pedestrian Safety Zones” and making it illegal to pass or make U turns in an active school zones.]
  • Regional high visibility enforcement campaigns were conducted throughout the year, which included an on-going program of Police Officers dressed in seasonal themed costumes in crosswalks in high crash locations in Las Vegas (i.e., Thanksgiving turkey, Santa, Leprechaun, etc.).
  • Support and coverage from media partners to get out the safety message, e.g. ABC Channel 13's (Las Vegas) “Be Smart, Be Safe, Be Seen” campaign for crosswalk safety.
  • A Bill Draft Request for Nevada's 2013 Legislative Session was prepared that includes six recommended changes to the Nevada Revised Statutes (NRS) to benefit pedestrian safety.
  • Source: Nevada SHSP Annual Report. 2013

In 2012, Nevada's SHSP Critical Emphasis Area (CEA) teams adopted a series of performance measures to track the impact of strategies adopted by each CEA (for their 2012-2016 SHSP), all of which tie to the number of fatalities and serious injuries.

The Nevada SHSP objectives were set as five-year average number of fatalities and serious injuries with 2008 (average of 2004 to 2008) as the baseline year. Nevada compiles their results into an Annual Report. The report shows progress for their performance measures and supporting data. It also summarizes the activities implemented to support the SHSP strategies.

The shaded content is an excerpt from Nevada's January 2013 Annual Report for their Pedestrian critical emphasis area. They document their safety progress towards a reduction in fatalities and serious injuries as well as provide the implementation status of their strategies.

Safety Progress on Pedestrians Fatalities and Serious Injuries

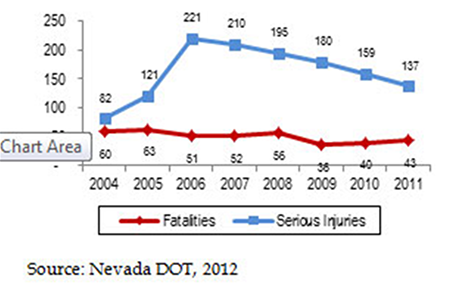
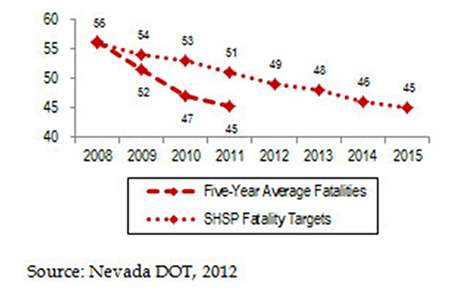
Between 2008 and 2011, pedestrian fatality numbers dropped by 23.2 percent and serious injuries decreased by 29.7 percent (Figure 3). The five year average number of pedestrian fatality and serious injuries both ended up lower than their targets (Figure 4).

Figure 3. Pedestrian Fatalities and Serious Injuries

"Line chart that plots two sets of data from Nevada DOT in 2012: pedestrian fatalities and serious injuries, respectively, in Nevada from 2004 to 2011 - 2004 (60, 82,); 2005 (63, 121); 2006 (51, 221); 2007 (52, 210); 2008 (56, 195); 2009 (38, 180); 2010 (40, 159); and 2011 (43, 137);"

Figure 4. Five Year Average Pedestrian Fatalities/Serious Injuries

"Line chart that plots two sets of data from Nevada DOT in 2012: SHSP Fatalities Targets and Five-Year Average Fatalities, respectively, in Nevada from 2008 to 2015 - 2008 (56, 56); 2009 (54, 52); 2010 (53, 47); 2011 (51, 45); 2012 (49, N/A); 2013 (48, N/A); 2014 (46, N/A); and 2015 (45, N/A);"

See these other SHSP Evaluation Noteworthy Practices:

Contact

Ken Mammen
Chief Traffic Safety Engineer
Nevada Department of Transportation
KMammen@dot.state.nv.us

Louisiana's Bottom Line on SHSP Implementation is Funding Support


Background

Potential stumbling blocks to implementation of Strategic Highway Safety Plans (SHSP) include funding for the projects and programs identified by the safety stakeholders and how to institutionalize project selection and funding over the long term. The Louisiana Department of Transportation and Development (DOTD) is using funds from the Highway Safety Improvement Program (HSIP) to address these challenges while keeping informed of stakeholder roadway safety needs and wants through the overall SHSP structure.

DOTD is using Highway Safety Improvement Program (HSIP) funds and staff to support regional safety coalitions who identify, develop, and implement behavioral and infrastructure road safety programs and projects. The Louisiana approach relies on a data driven decision making, widespread outreach and partnerships with State, regional, and local agencies and organizations, and a focus on addressing traffic related fatalities and serious injuries at the local level—where they occur.

The Approach - How It Works

Louisiana deploys a two-tier approach to SHSP implementation. Statewide initiatives are managed by the SHSP emphasis area teams while other projects and programs are implemented regionally through nine regional safety coalitions. The State finds regional implementation is an effective way to expand the SHSP focus at the local level. Under the DOTD program, HSIP provides funding for:

  • Regional safety coordinators, who establish and manage coalitions and develop regional safety plans reflecting SHSP goals, objectives, and proven effective strategies; and
  • Statewide and regional strategies and actions in the SHSP or regional safety plans.

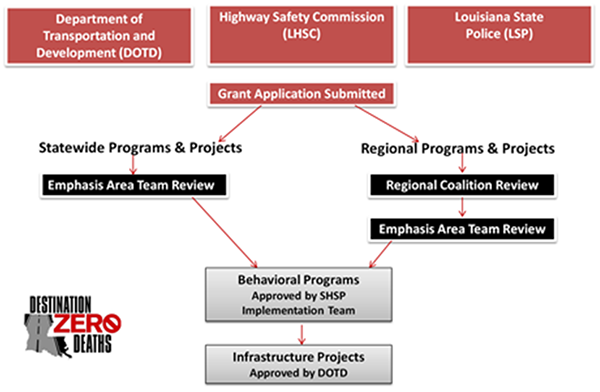
Louisiana SHSP Funding Process

"diagram of the Louisiana SHSP funding process"

Regional coalitions are funded through Metropolitan Planning Organizations (MPOs) to ensure necessary organizational support and continuity. As part of the agreement, MPOs are required to include safety in their Unified Planning Work Program (UPWP), which ensures safety has a place at the table. The effort started with a pilot program in the South Central region (see 2013 Noteworthy Practice) in conjunction with the National Highway Traffic Safety Administration's Safe Communities model. That program was successful, particularly in achieving reductions in alcohol-related and unrestrained serious injuries, and the approach was adopted and taken statewide.

DOTD recognized the need to select the appropriate people as regional coordinators and enlisted the help of MPO directors and staff to identify potential candidates. The coordinators generally have a marketing/public relations background and a demonstrated ability to work effectively with large groups. Once the coordinators were hired, DOTD conducted a training session and provided information on coalition building, data collection and analysis, meeting facilitation and management, presentation skills, evaluation, and marketing. Regional safety coordinators also participate in monthly conference calls to share ideas and information.

The program is administered by DOTD in coordination with the Louisiana Highway Safety Commission (LHSC) and the Louisiana State Police (LSP). Individuals or groups at the State or regional level interested in funding complete an application. Statewide projects are reviewed and approved by the relevant SHSP emphasis area team. Those designed to impact a region are reviewed and approved by the relevant regional team and sent to the appropriate emphasis area team for their consideration. The SHSP Implementation Team approves behavioral safety programs and projects and DOTD approves infrastructure related projects.

Key Accomplishments

  • Statewide SHSP emphasis area teams rely on the regional teams as a method for implementing programs and projects. Often ideas are pilot tested in one region and if successful, replicated statewide through the regional system.
  • The DOTD Secretary publically supports the effort and recognizes the need for the agency to provide financial and technical assistance for both infrastructure and behavioral safety projects.
  • LHSC supports regional safety coalitions through mini-grants for impaired driving and occupant protection programs, and the LSP Superintendent directs the Troop Commands to actively participate in the coalitions.
  • Regions use data-driven, multidisciplinary Road Safety Audits (RSAs) as a way to prioritize and implement low-cost engineering solutions at high crash intersections and horizontal curves.
  • The training and technical assistance needs for the regional and local stakeholders has led to an enhanced Local Technical Assistance Program (LTAP) program, and the creation of the Louisiana Center for Transportation Safety (LCTS), which provides support to the regions in the areas of workforce development and research, training, and technical assistance.

Results

  • Traffic related fatalities continue to decrease in Louisiana. After a slight increase in 2011, fatalities continued to move in the right direction in 2013 and 2014. Serious injuries have continued a downward trend.
  • Since DOTD began contributing HSIP funding for increased enforcement, safety belt use has gone from 77 percent to 84 percent.
  • The initial regional pilot project in the South Central Region of the State has achieved a 17 percent decrease in fatalities.

Key Accomplishments and Results

Measured reductions in alcohol-related serious injuries as well as in serious injuries resulting from lack of seatbelt use.

Contact

Dan Magri
Safety Highway Administrator
Louisiana Department of Transportation and Development
225-379-1200
Dan.Magri@la.gov