The Nevada practice is discussed after the following introduction about Strategic Highway Safety Plan (SHSP) evaluation.
Other states in this SHSP Evaluation Noteworthy Practices series: ID and WA
Planning for Evaluation Should Begin When the SHSP is Developed
The Highway Safety Improvement Program (HSIP) requires States to evaluate their Strategic Highway Safety Plan (SHSP) to ensure the accuracy of their SHSP priorities and proposed strategies. Furthermore, evaluation helps States answer basic questions about the progress of their SHSP such as:
- What are we trying to do?
- How well are we doing it?
- How can we improve?
States that have successfully integrated evaluation into their SHSP process have realized the opportunity it provides to strengthen their SHSP efforts. Benefits include demonstrating the SHSP's contribution to transportation safety; uncovering challenges in prioritizing or implementing programs and strategies; determining progress in meeting SHSP goals and objectives, and; validating emphasis areas and strategies, or revealing the need to revise them.
Following are examples of how States have put evaluation into action.
- Outcome performance measures: how they will measure progress towards their goals and objectives.
- Priority strategies: those evidence-based or promising strategies that have the greatest potential to help them reach the emphasis area goals and objectives.
- Output performance measures: activity measures that help document program implementation.
It is never too early to institute evaluation; in fact, planning for evaluation should begin when the SHSP is developed. During the early stages of SHSP development attention should be given to how progress will be measured and success determined.
Nevada's Practice
SHSP Annual Report Helps Nevada Monitor Performance Measures Progress
Implementation Status for Strategy:
Enforce pedestrian laws at high crash locations;
pursue judicial follow through.
- Funding secured from a Nevada Joining Forces grant to augment enforcement related to pedestrian safety and speed.
- Courts were briefed on potential changes in the law to improve pedestrian safety. [Update! Nevada was successful in changing laws to improve pedestrian safety in the 2015 legislative session, which was due to the efforts of the Pedestrian Critical Emphasis Area and Pedestrian Task force. These laws included the use of “Pedestrian Safety Zones” and making it illegal to pass or make U turns in an active school zones.]
- Regional high visibility enforcement campaigns were conducted throughout the year, which included an on-going program of Police Officers dressed in seasonal themed costumes in crosswalks in high crash locations in Las Vegas (i.e., Thanksgiving turkey, Santa, Leprechaun, etc.).
- Support and coverage from media partners to get out the safety message, e.g. ABC Channel 13's (Las Vegas) “Be Smart, Be Safe, Be Seen” campaign for crosswalk safety.
- A Bill Draft Request for Nevada's 2013 Legislative Session was prepared that includes six recommended changes to the Nevada Revised Statutes (NRS) to benefit pedestrian safety.
- Source: Nevada SHSP Annual Report. 2013
In 2012, Nevada's SHSP Critical Emphasis Area (CEA) teams adopted a series of performance measures to track the impact of strategies adopted by each CEA (for their 2012-2016 SHSP), all of which tie to the number of fatalities and serious injuries.
The Nevada SHSP objectives were set as five-year average number of fatalities and serious injuries with 2008 (average of 2004 to 2008) as the baseline year. Nevada compiles their results into an Annual Report. The report shows progress for their performance measures and supporting data. It also summarizes the activities implemented to support the SHSP strategies.
The shaded content is an excerpt from Nevada's January 2013 Annual Report for their Pedestrian critical emphasis area. They document their safety progress towards a reduction in fatalities and serious injuries as well as provide the implementation status of their strategies.
Safety Progress on Pedestrians Fatalities and Serious Injuries
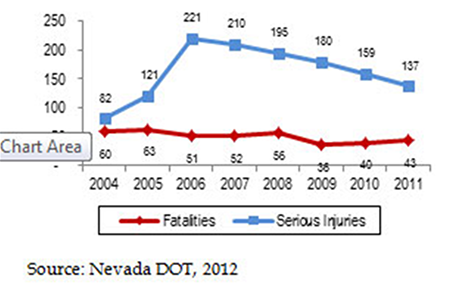
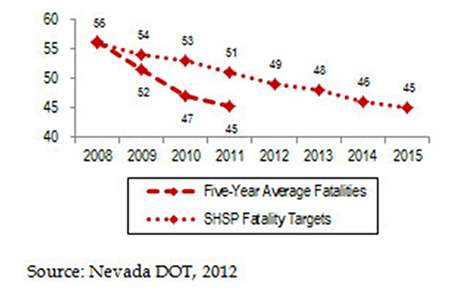
Between 2008 and 2011, pedestrian fatality numbers dropped by 23.2 percent and serious injuries decreased by 29.7 percent (Figure 3). The five year average number of pedestrian fatality and serious injuries both ended up lower than their targets (Figure 4).
Figure 3. Pedestrian Fatalities and Serious Injuries

Figure 4. Five Year Average Pedestrian Fatalities/Serious Injuries

See these other SHSP Evaluation Noteworthy Practices:
Contact
Ken Mammen
Chief Traffic Safety Engineer
Nevada Department of Transportation
KMammen@dot.state.nv.us
