The process of identifying curves for HFST varies by agency. Questions agencies may ask while identifying candidate curves for HFST include:
- Is there an existing safety issue?
- Is wet weather contributing to the issue?
- Is the friction demand outweighing available friction?
- Are speed differentials, the difference between the tangential posted speed limit and the curve advisory speed, contributing to crash frequency?
- Are prior low-cost treatments not sufficiently effective?
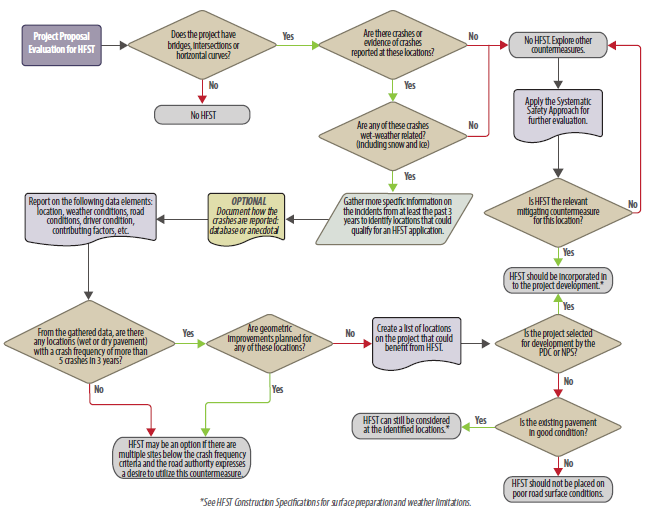
These questions can be answered and navigated using a decision tree. Figure 11 displays a possible decision tree scenario that agencies may use when considering HFST. After evaluating the effectiveness of multiple HFST implementations, agencies may migrate from spot treatments to systemic implementation, which both streamlines the HFST design process and reduces costs. Table 3 displays the HFST feasibility criteria considered by four States, each of whom have or are planning to implement HFST at 25 to 150 locations. Agency's process may vary from information presented in this chapter.
| Agency | Crash Frequency | Wet Crashes | RwD Crashes | Skid/Friction Values | Curve Speed Diff. | Prior Treatments Installed | Pavement Quality | Spot/Systemic Identification and/or Implementation |
|---|---|---|---|---|---|---|---|---|
| SCDOT | X | X | X | X | X | X | X | Systemic – State RwD Plan |
| Caltrans | X | X | X | X | X | Spot Treatment Bundles projects into large contracts | ||
| PennDOT | X | X | X | X | X | X | Systemic – Statewide HFST initiative | |
| TDOT | X | X | X | X | X | X | Systemic – Statewide HFST initiative | |
| KYTC | X | X | X | X | X | X | Systemic – Statewide HFST initiative |
Figure 11. Identifying HFST Appropriateness and Feasibility on Horizontal Curves Flow Chart