USA Banner

Official US Government Icon

Official websites use .gov
A .gov website belongs to an official government organization in the United States.

Secure Site Icon

Secure .gov websites use HTTPS
A lock ( ) or https:// means you’ve safely connected to the .gov website. Share sensitive information only on official, secure websites.

U.S. Department of Transportation U.S. Department of Transportation Icon United States Department of Transportation United States Department of Transportation

Safety Programs

Overcoming Limited Data to Identify High Risk Rural Road (HRRR) Projects


Describe the roadway safety situation or state before the new practice was implemented. What was the safety issue, problem, or gap?

Kansas recognized a gap between the data needed to identify safety projects that qualified for High Risk Rural Road funding and the data available. The limited data they did have pointed to a need for a program that reduced roadway departures in order to decrease collisions with fixed objects, which is the most common rural fatality crash type in the State.

What were the key challenges that needed to be addressed before the new practice could be implemented?

Without detailed data, Kansas was having difficulty identifying projects that qualified for High Risk Rural Road project funding. Statewide data revealed crash problems, but a lack of site-specific rural road data, along with the randomness of crashes on county roads, restricted the agency’s ability to complete data-driven analysis for specific locations.

Describe the new practice.

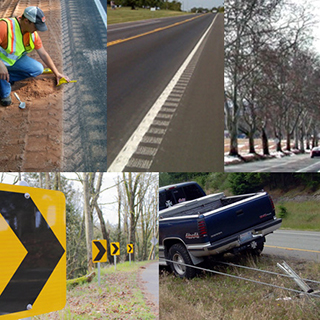
"collage of photos: SafetyEdgesSM preparation and installation, a tree-lined roadway, a pickup truck, and yellow signs with Bear Right arrows along a curving road"

Kansas Department of Transportation (KDOT) staff realized a systemic safety approach would enable them to use High Risk Rural Road funding to apply low-cost treatments systemically on county roads that shared common crash risk factors, effectively improving safety in those locations.

KDOT has funded widespread installation of low-cost countermeasures such as the SafetyEdgeSM, pavement markings, rumble strips, tree removal, enhanced signing, and improvements to roadside barriers such as culvert headwalls and guardrails.

What technical and/or institutional changes resulted from the new practice?

The new approach became the foundation for the way KDOT identifies and programs projects to be treated through High Risk Rural Road funding.

Institutionally, teamwork had to become a priority for this practice to succeed. The process of identifying sites for treatment includes input from and coordination with local agencies, the Local Technical Assistance Program, the FHWA Division Office Safety Engineer, a metropolitan planning organization, the Kansas association of counties, as well as county police and emergency response representatives.

What benefits were realized as a result of the practice?

Focusing its high risk rural road funding through a systemic approach has allowed Kansas to invest in extensive low cost countermeasures since 2011.

KDOT considers the ever-increasing popularity of the program among the counties to be a sign that the program is successful. In addition, local agencies have expressed that this approach is adding value to their system by increasing safety.

Contact

Steven Buckley
Kansas State Bureau of Transportation Safety & Technology
Steven.Buckley@ks.gov

Ohio Economic Crash Analysis Tool (ECAT) Supports Benefit-Cost Analysis

Publication Year: 2017


Background

The Ohio Department of Transportation (ODOT) uses a data-driven approach to identify, screen, and prioritize potential highway safety improvement projects. ODOT analyzes crash, roadway, and traffic data to identify sites with potential for safety improvement. Typically, ODOT studies up to 300 locations annually across the State. ODOT District offices and local agencies diagnose safety issues at these locations and develop targeted countermeasures to address the underlying crash contributing factors. The District offices develop funding applications for safety projects and submit the applications to the Central Office for further consideration. Multidisciplinary committees review and evaluate the project applications based on factors such as crash analysis; statewide, regional or local priority; matching funds; and benefit-cost analysis.

Each year, ODOT reviews approximately 70 applications for safety improvement projects. While ODOT spends more than $100 million annually on highway safety improvement projects, the funding requests total more than $150 million. As such, there is a need to prioritize those projects with the greatest potential for reducing crashes.

Solution

To support the highway safety project prioritization process, ODOT developed the Economic Crash Analysis Tool (ECAT). ECAT supports analysts in estimating the safety performance of a given facility (existing or proposed), conducting alternatives analyses, and completing a benefit-cost analysis. This tool automates much of the analysis, simplifying the process and allowing people with various skill levels to use the tool and make better safety investments.

In developing ECAT, ODOT reviewed available spreadsheets such as those developed for the implementation of the Highway Safety Manual (HSM). This provided the foundation for the underlying safety performance calculations. To simplify the process, ODOT combined multiple HSM-related spreadsheets into a single spreadsheet.

Using ECAT for benefit-cost analysis, the user selects the site type and enters basic project information such as costs and safety benefits. The user can specify various costs, including the initial construction cost, operating and maintenance costs, and salvage value. Analysts use other supporting modules in ECAT to estimate the safety benefits in terms of change in predicted and expected crashes. The tool provides default values for inputs such as the projected service life. Based on the user inputs for costs and benefits, the tool computes the present value costs and benefits based on a discount rate of 4.0 percent.

The following figures provide examples of outputs from the benefit-cost analysis module in the ECAT tool. Figure 1 shows an example of the economic analysis summary table from ECAT, which indicates the net present value of the project (i.e., present value cost), the net present value of safety benefits (i.e., present value benefit), net benefit (i.e., present value benefit minus present value cost), and benefit-cost ratio (i.e., present value benefit divided by present value cost). The summary table also indicates the expected annual crash adjustment in terms of the change in the number of fatal and incapacitating injury crashes, change in the number of all injury crashes, and the change in total crashes.

"Figure 1. Sample economic analysis summary tables from ECAT."

Figure 1. Sample economic analysis summary tables from ECAT.

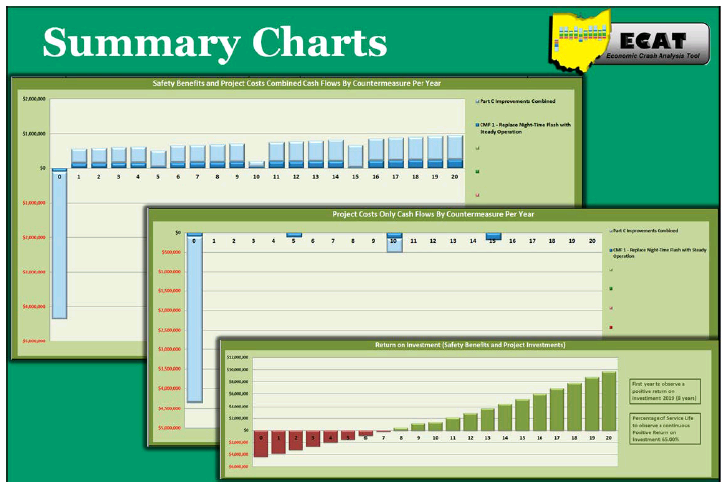
Figure 2 shows an example of the economic analysis summary charts from ECAT. The upper left chart presents a summary of the combined projected cash flows by countermeasure by year. Negative cash flows represent an expenditure (greater investment than return) and positive cash flows represent a return on investment. The middle chart presents a summary of cash flows by year for project costs only. This example shows an initial project cost in year 0, and either maintenance or rehabilitation costs in years 5, 10, and 15. The bottom right chart shows the return on investment (i.e., cumulative annual benefits minus cumulative annual cost). Users can quickly identify the breakeven year as the first year with a positive return on investment. In this example, the breakeven year is year 8.

"Sample economic analysis summary charts from ECAT."

Figure 2. Sample economic analysis summary charts from ECAT.

Sources

Traffic Academy Safety Studies & Freeway Safety Study Guidelines
Ohio Department of Transportation, 2017

Highway Safety Manual
Ohio Department of Transportation
Division of Planning
Office of Systems Planning and Program Management, February 2017

Contact

Tim McDonald
Ohio Department of Transportation
Office of Planning
Tim.Mcdonald@dot.ohio.gov
(614) 466-4019

Resources

ODOT requires the use of ECAT for all safety studies completed on the State highway system. To support users, ODOT posts examples and help files along with the tool on the ODOT Highway Safety Improvement Program website. ODOT posts enhancements and updates to the tool with release notes documenting changes.

The tool and supporting documentation are available from the Office of Systems Planning and Program Management, Highway Safety Manual Data Analysis Tools webpage. (This page is no longer available.)

FDOT’s Transportation Value to You (TransValU) Supports Benefit-Cost Analysis

Publication Year: 2017


Background

Transportation agencies are often faced with difficult decisions and need to answer questions like “which transportation project will provide the greatest return on investment?” To answer such questions, there is a need to quantify and compare the relative benefits and costs of project alternatives.

Solution

The Florida Department of Transportation (FDOT) District Five created a tool to perform economic analysis and address such questions. Transportation Value to You (TransValU) is a spreadsheet-based tool designed for corridor-level economic and financial analyses of proposed transportation investments. FDOT District Five uses the tool to assess projects focused on passenger movements, including highway, transit, bicycle/pedestrian, and combinations of these modes. The District also uses the tool to assess projects related to the movement of goods, including highway freight, rail freight, and intermodal logistics centers.

Three types of analyses are available within the tool: Benefit-Cost Analysis (BCA), Economic Impact Analysis (EIA), and Financial Analysis. For the BCA and EIA, the tool includes separate modules for the analysis of projects focused on passenger movements and projects focused on goods movements. There is only one module for financial analysis, which is the same for all project modes.

Benefit-Analysis Module

The purpose of BCA is to monetize as many of the costs and benefits of a project, program, or policy as possible. This involves quantifying the benefits and costs of an alternative relative to a base condition to determine whether the net benefits of a project outweigh the costs. TransValU provides a framework to quantify all capital, operating, and maintenance costs, as well as a wide range of benefits. TransValU provides results to help identify the alternative or mix of alternatives that maximizes net benefits or social welfare per dollar invested. The tool provides a side-by-side comparison of multiple alternatives through performance measures such as net present value, benefit-cost ratio, overall rate of return, and discounted payback period.

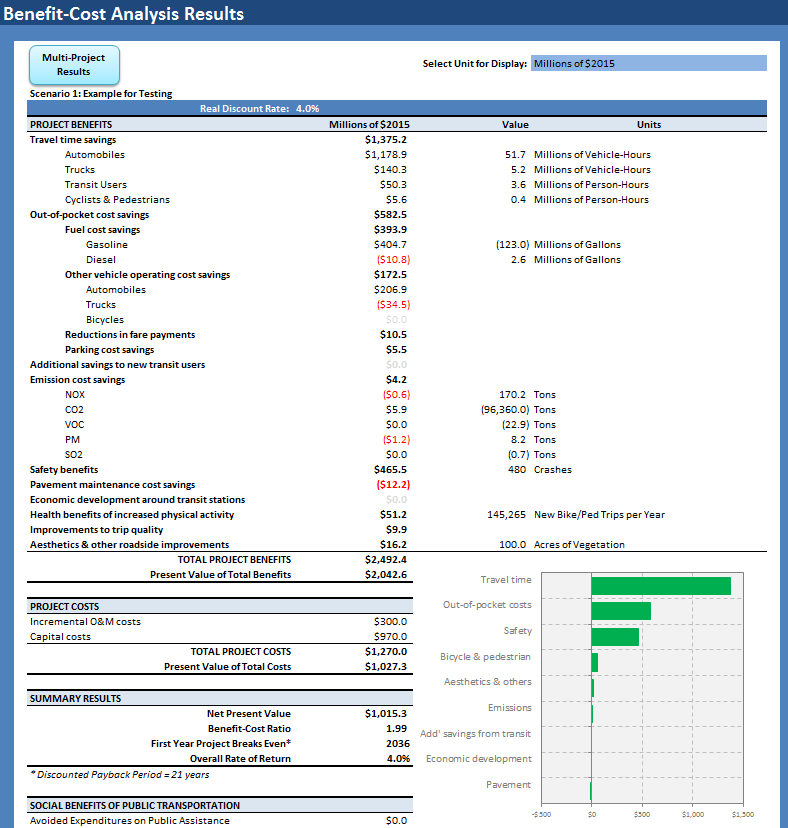
Figure 1 shows an example of the output from a BCA generated with TransValU. The project benefits include the travel time savings, out-of-pocket cost savings (e.g., fuel use, parking, etc.), emissions cost savings, safety benefits, pavement maintenance cost savings, economic development near transit stations, health benefits, improvements to trip quality, and aesthetic improvements. Notice the difference in project benefits among the various factors. For example, the safety benefits represent approximately 20 percent of the total project benefits. These benefits are plotted in the lower right of the figure to show the relative contribution of each factor. The project costs include the capital costs and continuing operations and maintenance (O&M) costs. Both the benefits and costs are converted to present value using the selected discount rate. The summary provides the net present value, benefit-cost ratio, overall rate of return, and discounted payback period. In this case, the discounted payback period is 21 years, and the figure notes the first year the project is projected to breakeven is 2036.

"Screenshot of BCA output from TransValU"

Figure 1. Sample BCA output from TransValU.

Economic Impact Analysis Module
The purpose of the EIA module is to assess the effects of a project, program, or policy on the economy of a state or region, focusing on changes in economic activity. Economic impacts are expressed as changes in business sales (output), gross regional product (GRP) or “value added,” employment, and earnings. TransValU estimates the short-term economic impacts resulting from spending on transportation projects. Long-term economic impacts are also estimated for freight projects. These are lasting impacts resulting from improvements to a transportation facility.

Financial Analysis Module
The financial analysis module focuses on the flows of money to and from a project or organization, typically a firm or government agency. It helps identify the project or alternative that maximizes net inflows (e.g., total revenue minus total expenses). A financial analysis from the perspective of a government agency looks at the impacts of a project on government expenditures and receipt.

Benefits

TransValU helps to assess the impacts of capital projects based on changes in any of the following variables:

  • Changes in the number of crashes by severity resulting from projects that reduce the likelihood of crashes at a specific location and/or projects that entice travelers to use relatively safer modes.
  • Changes in vehicle miles traveled (VMT) and/or vehicle hours traveled (VHT) from highway investments and/or spending in other modes affecting highway travel through modal shifts.
  • Changes in the number of transit riders and/or the average transportation costs borne by transit riders, including in-vehicle travel time, waiting time, and fares.
  • Changes in the number of bicycle users or pedestrians and/or changes in their average door-to door travel times.
  • Changes in the percent breakdown of the transit vehicle fleet (e.g., diesel, hybrid, compressed natural gas, or electric buses and trains).
  • Changes in the extent of roadside aesthetic improvements, expressed as additional acres of vegetated right-of-way.
  • Changes in freight rail movements or volumes of goods handled at an integrated logistics center.

While the tool was developed by FDOT District Five, it provides the ability to perform district-level analysis for other FDOT districts. It also provides the ability to perform county level analysis, but only within District Five.

The BCA modules are consistent with the USDOT guidance for TIGER and FASTLANE grant applications. This includes methods for the valuation of impacts related to safety, travel time, and emissions. It also supports the estimation of benefits from investments in pedestrian and bicycle facilities. Using the results, agencies can make more consistent and informed decisions when developing policy or comparing and selecting project or program alternatives.

Sources

Refer to the following link for further information on the tool.
http://cfgis.org/FDOT-Resources/TransValU.aspx

Contact

Central Florida Geographic Information Systems
455 N. Garland Ave. 
Suite 414
Orlando, FL 32801
Tara McCue, Director of Planning
tara@ecfrpc.org
407-245-0300

Caltrans CAL-B/C Tool Supports Benefit-Cost Analysis for Highway and Transit Projects

Publication Year: 2017


Background

The California Department of Transportation (Caltrans) must continuously justify the economic effectiveness of their programs and expenditures. In selecting among alternative projects and programs, there is a need to quantify and compare factors such as safety performance, pavement preservation, operational performance, and environmental impacts. Benefit-cost analysis (BCA) supports these decisions by quantifying life-cycle costs and benefits, which helps to understand the potential return on investment from alternative projects and programs. While Caltrans routinely quantifies and compares project costs and benefits, there was a need to automate the calculations to improve the efficiency and consistency of analysis.

Solution

Caltrans developed the Cal-B/C tool for BCA of highway and transit projects. It is an Excel spreadsheet application structured to analyze transportation improvement projects in a corridor where there already exists a highway facility or a transit service (the base condition). The tool calculates benefits for existing and (optionally) for induced traffic, as well as for any traffic diverted from a parallel highway or transit service. It estimates benefits separately for peak and off-peak periods as well as for high occupancy vehicle (HOV) and non-HOV passenger vehicles and trucks.

Analysts can use the tool to evaluate highway projects such as general improvements, HOV and passing lanes, interchange improvements, and a bypass highway. Transit projects may include new or improved bus services, with or without an exclusive bus lane, light-rail, and passenger heavy-rail projects. Analysts can evaluate a proposed highway or transit project independently or in the presence of the competing mode, in which case the tool estimates the benefits to diverted traffic.

For costs, the analyst can enter the total life cycle investment and annual operating and rehabilitation costs. The tool considers the following categories of benefits:

  • Travel time.
  • Safety (both highway and transit).
  • Vehicle operating costs (for highway users).
  • Emissions (CO, NOx, PM10, VOC) (optional output).

The tool provides the following economic performance measures:

  • Net present worth.
  • Benefit-cost ratio.
  • Internal rate of return.
  • Payback period.

Example Application

Description and Purpose of Project

The Commercial Vehicle Information Systems and Networks (CVISN) Program seeks to expand electronic credentialing and screening of commercial vehicles to improve safety and efficiency. CVISN is intended to enhance the safety and efficiency of commercial vehicles nationwide. Benefits include lower costs for vehicle credentialing and operations and more effective safety inspections. Trucks with good safety records save time by bypassing inspection stations at highway speeds. The public benefits from the program through decreased energy consumption and noise pollution. In addition, a more effective inspection system will result in safer commercial vehicles on the road and thus fewer heavy truck accidents.

Alternatives Considered

For this study, a benefit-cost analysis was conducted separately for two CVISN components, roadside enforcement and electronic credentialing.

For roadside enforcement, the analysis included three alternatives. The first was an upgrade of inspection station computer systems, but without electronic screening. The second was an upgrade from the first scenario to electronic screening and additional station improvements. The third, treated as a sensitivity analysis, entailed the same as the second, with the added assumption that the motor carrier safety regulation violation rate will decrease by 25 percent.

For electronic credentialing, the analysis included two alternatives. The first was electronic credentialing for states not using the Vehicle Information System for Tax Apportionment (VISTA). The second was electronic credentialing for those states currently using VISTA.

Results

Table 1 shows the results of the BCA for the three roadside enforcement scenarios. The benefits include crashes avoided and transit-time savings. The costs include the startup costs, replacement costs, operating costs to states and carriers, and out-of-service costs to carriers. The total value of the benefits and costs are in 1999 U.S. dollars discounted at 7 percent. From these results, it is apparent that the upgrade to electronic screening (scenario 2) provides a net benefit with a net present value of $2,665,400,000 and a benefit-cost ratio of 2.0, indicating a return of $2 for every $1 spent. If this results in a reduction in the rate of motor carrier safety regulation violations (scenario 3), then this project would return even greater benefits. Notice how the value of crashes avoided compares to the value of travel time savings for the three scenarios.

Table 1. Benefit-Cost Analysis for Roadside Enforcement Scenarios.

Benefits and CostsScenario 1Scenario 2Scenario 3

Benefits

Crashes avoided

$69,076,000

$484,300,000

$8,178,000,000

Transit-time savings (including operations and maintenance as well as air and noise pollution)

$0

$4,817,000,000

$4,817,000,000

Total benefits

$69,076,000

$5,301,300,000

$12,995,000,000

Costs

One-time startup costs to states

$30,980,000

$99,500,000

$99,500,000

Replacement capital costs to states

$51,208,000

$86,400,000

$86,400,000

Increased operating costs to states

$9,512,000

$178,700,000

$178,700,000

Increased operating costs to carriers

$0

$2,131,900,000

$2,131,900,000

Increased out-of-service costs to carriers

$19,891,000

$139,400,000

$104,500,000

Total Costs

$111,591,000

$2,635,900,000

$2,601,000,000

Net Present Value

-$42,515,000

$2,665,400,000

$10,394,000,000

Benefit/Cost Ratio

0.62

2.0

5.0

Table 2 shows the results of the BCA for the two electronic credentialing scenarios. The benefits include operating cost savings to state and carriers as well as inventory cost savings to carriers. The costs include the startup costs and replacement costs to states. The total value of the benefits and costs are in 1999 U.S. dollars discounted at 7 percent. From these results, it is apparent that the upgrade to electronic credentialing provides a net benefit whether implemented in states with or without VISTA. The greatest net benefit is to those states not using VISTA with a net present value of $513,220,000. The return on investment is greatest for those using VISTA with a benefit-cost ratio of 40.4.

Table 2. Benefit-Cost Analysis for Electronic Credentialing Scenarios.

Benefits and CostsScenario 1Scenario 2

Benefits

Operating cost savings to states

$257,900,000

$240,800,000

Operating cost savings to carriers

$56,700,000

$18,600,000

Inventory cost savings to carriers

$243,100,000

$79,900,000

Total Benefits

$557,700,000

$339,300,000

Costs

One-time startup cost to states

$42,140,000

$7,200,000

Replacement capital costs to states

$2,340,000

$1,200,000

Total Costs

$44,480,000

$8,400,000

Net Present Value

$513,220,000

$330,900,000

Benefit/Cost Ratio

12.5

40.4

Source

Brand, D., T. E. Parody, J. E. Orban, and V. J. Brown. "Benefit-Cost Analysis of the Commercial Vehicle Information Systems and Networks Program." Transportation Research Record: Journal of the Transportation Research Board, No. 1800, TRB, National Research Council, Washington, D.C., 2002. pp. 35-43.

Contact

CalTrans Office of State Planning, Transportation Economics Branch
Rose Agacer (rose.agacer@dot.ca.gov), Economist for the Transportation Economics Branch

HSIP Program Evaluation and Progress Reporting in New York


Problem/Issue

The New York State Department of Transportation (NYSDOT) is a decentralized organization comprised of 11 regions. As part of the Highway Safety Improvement Program (HSIP), the central office sends out a list of Priority Investigative Locations (PILs) and High Accident Locations (HALs) to the regions each spring. The regions use this information to create their Annual Regional Work Program. Specifically, the regions conduct approximately 350 Highway Safety Investigations (HSIs) annually to evaluate 20 percent of the high crash locations. The HSIs result in capital projects, which are often low-cost safety improvements, but can include more costly reconstruction projects at locations with correctable crash patterns.

While the regions are responsible for implementing safety projects, the central office is primarily responsible for conducting evaluations and tracking statewide statistics and progress as part of the Highway Safety Improvement Program (HSIP). The central office developed an annual HSIP report and statewide progress report, but these were the only feedback mechanisms for both the State and the regions. The central office wanted a way to track overall progress toward the regional work plans and several other organizational goals: HSI completion, percent obligation of HSIP funds, and implementation of focused safety programs (e.g., installation rates of centerline rumble strips and pedestrian countdown timers). When the central office gathered regional representatives to present a statewide progress report, the regions requested more nuanced reports to show progress at the regional level.

Prior to developing regional reports, it was important to the central office to stress that reporting at the regional level was not intended to highlight individual regions for lagging behind or not meeting goals. Rather, the intent was to improve performance management and encourage regions through positive feedback. If a region was lagging behind, then the central office worked with the region to identify and resolve the challenges or issues.

Solution

As a result, NYSDOT now implements an activity-based approach to program evaluation and progress reporting. The central office develops quarterly reports that contain a number of performance measures—both automated and manual components—including the number of activities performed by each region. Then, the central office gathers the regional traffic engineers to present and review the progress reports.

The report is a management tool that aims to provide a summary of the State’s progress as a whole, track work plan progress, and bring any regional resource or process issues to light for discussion. As the regions identify issues, they can work together with the central office to develop solutions. To allay some of the concerns that the reports would negatively highlight some regions over others, the central office only distributes the quarterly reports internally and only distributes the regional dashboards to the individual region. Executive management and regional traffic engineers receive the reports, which emphasize areas in need of improvement and areas of excellence. Additionally, NYSDOT provides one-page dashboards summarizing fatalities, serious injuries, and progress toward SHSP emphasis area performance measures.

Benefits

NYSDOT uses the quarterly reports to continually track and evaluate HSIP projects and programs. For example, the central office tracks the number of times a site appears on the HSI list, which allows them to assess how well the system is working. The documentation of HSIs and follow-up evaluations of resulting projects helps to defend against tort claims. Regional traffic engineers are also positioned to track and evaluate projects in their regions. This improves their knowledge of the greatest needs and challenges as well as the most successful projects. Together, the central and regional offices have a better understanding of how activities and projects contribute to the statewide safety goals and outcomes.

One region in particular was falling behind due to resource management issues. When their progress was revealed in the quarterly report, the region worked with the central office to modify its processes and allocate resources more effectively, resulting in a dramatic improvement that was reflected in subsequent progress reports.

Although the detailed reports were initially requested by the regions, the data they provide has helped achieve both regional and central office goals. Now, the central office better understands the importance of messaging and project rollout, which have become important for progress reporting. In turn, the ongoing communication from the central office has led to improved project tracking and ownership at the regional level.

The reporting practice has also created opportunities for additional improvements across the system. For example, the central office identified the opportunity to enhance HSIP evaluation practices by reducing the number of HSIs required.

Contact

Regina Doyle
New York State Department of Transportation
(518) 485-0164
Regina.Doyle@dot.ny.gov

HSIP Countermeasure Evaluation in Kentucky


Problem/Issue

The Kentucky Transportation Cabinet (KYTC) is responsible for performing Highway Safety Improvement Program (HSIP) evaluation, including project tracking and crash modification factor (CMF) development. While KYTC staff administer and provide high-level guidance on the HSIP, they have limited in-house capacity and capability to develop CMFs and delve deeper into specific statistical issues. One statistical issue is related to sample size, where there are small sample sizes of a particular treatment due to high construction costs or unique situations in which it is implemented. KYTC has been challenged with finding statistical analysis strategies to best evaluate the benefits of countermeasures with small samples.

Solution

To address these issues, KYTC turned to their long-standing partnership with the Kentucky Transportation Center (KTC), housed within the University of Kentucky. The Division of Traffic Operations in KYTC’s Central Office administers Kentucky’s HSIP funds. Using these funds, KYTC sets up a contract with KTC to provide technical assistance such as data analysis, evaluation of project effectiveness, evaluation of project completion, HSIP Annual Report assistance, and other technical activities that support HSIP administration in Kentucky. The agreement typically runs for two-year periods, functioning much like an on-call agreement. The relationship between the two organizations works efficiently and has allowed Kentucky to perform HSIP evaluations and experiment with unconventional evaluation methods to address concerns with small sample sizes.

Benefits

The strong relationship between the agencies demonstrated its value when KYTC initiated a study to evaluate the safety effects of three focused safety programs: rumble strips, high friction surface treatments, and cable median barriers. Historically, KYTC and KTC have used the Empirical Bayes (EB) before-after approach for HSIP evaluations to estimate the expected change in crash frequency. In these evaluations, KTC identified small sample sizes as a potential challenge to using the EB approach. In addition to the EB method, KTC suggested the Wilcoxon signed-rank test of proportions1 to compare the safety performance before and after implementation.

Countermeasures such as rumble strips, high friction surface treatments, and cable median barriers target specific crash types such as run-off-road and head-on crashes. While the EB method would indicate the expected change in crash frequency for a given crash type, the Wilcoxon signed-rank test would indicate if the proportion of target crash types changed after implementation. Specifically, the Wilcoxon signed-rank test of proportions assesses the statistical significance of before-after shifts in target crashes proportionately. In this process, using the proportion of target to total crashes, the target crash types are normalized by total crashes at each site for before and after periods.

KTC used both the EB before-after method and the Wilcoxon signed-rank test to evaluate the safety effects of the three programs. The EB before-after method served as a comparison to the results from the Wilcoxon signed-rank test. A comparison of the results demonstrated a general consistency in results between the Wilcoxon signed-rank test and the EB method, recognizing the Wilcoxon signed-rank test focuses on crash proportions and the EB method focuses on mean crash frequencies. While statistical methods are not a replacement for a large sample of high-quality data, these results suggested the Wilcoxon test can be used as further verification when evaluating countermeasures. The literature suggests the Wilcoxon signed-rank test can support statistical analysis with relatively small sample sizes, particularly when there is a large shift in proportions from the before to the after period and the shift is relatively consistent across sites.2 The required sample size increases as the shift in proportions decreases and as the variance of the shift in proportions increases among sites.

KYTC and KTC will continue to use the Wilcoxon signed-rank test as a complementary method to the EB analysis. The two agencies will also continue to work together to explore new methods for project evaluation and build from past experience. For example, as part of the cable median barrier evaluation, KYTC identified an issue with how police officers are coding median crossovers on crash reports. In response, KTC performed a manual review of hundreds of police reports and created an algorithm to determine whether a median crossover actually occurred in a crash. There are follow-up efforts to educate officers on the appropriate criteria for reporting median crossovers.


1
Refer to section 9.4.3 of the Highway Safety Manual for a more detailed description of the Wilcoxon signed-rank test.
2
Shieh, G., S.L. Jan, and R.H. Randles (2007). Power and sample size determinations for the Wilcoxon signed-rank test. Journal of Statistical Computation and Simulation, 77:8, 717-724.

Contact

Tracy Lovell
Division of Traffic Operations, Kentucky Transportation Cabinet
(502) 782-5534
Tracy.Lovell@ky.gov

HSIP Project Tracking in Alaska


Problem/Issue

The Alaska Department of Transportation and Public Facilities (ADOT&PF) is dedicated to improving practices within the agency. The ADOT&PF headquarters manages the overall Highway Safety Improvement Program (HSIP). However, the three regions within ADOT&PF (Northern, Central, and Southcoast) are responsible for nominating, planning, designing, constructing, and tracking projects. In consideration of this decentralized approach and the large scope of the State, ADOT&PF wanted to explore a more efficient communication and project tracking mechanism.

Solution

In 1998, ADOT&PF published the first edition of the Alaska HSIP Handbook and began tracking all safety projects in Microsoft Excel spreadsheets. The Handbook clearly defines the process of HSIP project development, implementation, tracking, and evaluation. The Handbook also addresses the handling of funds and project delivery activities. ADOT&PF reviews and updates the Handbook annually or on an as-needed basis to address changes in law, program and policy rules, and clarifications.

Alaska uses an Obligation Tracking Spreadsheet to track obligations on all new and ongoing projects. ADOT&PF updates the spreadsheet in the fall (typically November 1) to align with expected obligations in the HSIP Funding Plan. When a region requests approval to obligate funds on an HSIP project, headquarters staff verify the project is identified in the HSIP Funding Plan (or in a previous Funding Plan, in the case of a construction overrun or change order), then record the amount and the funding type in the spreadsheet (along with date and reason).

Data for tracking the program’s performance comes from the regional offices. Specifically, the regions prepare an HSIP Project Evaluation Spreadsheet to compile project-level details for each completed project, tracking critical project details such as three-year post-construction data. The spreadsheet provides an overview of project performance, including the benefit-cost ratio based on both the construction cost and the maintenance costs over the analysis period. The spreadsheet annualizes crash data for comparison of before and after periods, which is particularly useful if the before and after periods are different duration. The regional offices are responsible for collecting post-project crash data, entering project data in the spreadsheet, and submitting the tracking spreadsheets to headquarters. Headquarters aggregates the individual project data into a master spreadsheet to evaluate the effectiveness of countermeasures and the entire HSIP program, track the frequency of implemented countermeasures, and provide an historical listing of completed projects.

Benefits

The benefits of ADOT&PF’s spreadsheets and HSIP Handbook reach beyond a streamlined reporting system. The process has also resulted in improved HSIP reporting, project evaluation, countermeasure identification and benefit-cost ratios, as well as improved funding allocation.

In Alaska, each project is evaluated based on a standard evaluation form and methodology, comparing pre- and post-implementation crash data and developing measures of effectiveness appropriate for the countermeasures selected for use in the project. The consistent project tracking and reporting facilitates evaluation of HSIP projects. Due to small sample sizes of similar projects, ADOT&PF does not develop state-specific crash modification factors (CMFs); however, headquarters is able to adjust statewide CMFs based on the collective evaluation of projects facilitated by regional project tracking.

Headquarters tracks the different countermeasures used on HSIP projects along with the number of sites at which a particular countermeasure was implemented. After the projects are constructed and evaluations are complete, ADOT&PF compares the expected benefit-cost ratio to the actual benefit-cost ratio, which helps the State make better estimations for future projects. For example, they can use the evaluation results to identify types of projects that are more or less effective, and implement effective, low-cost countermeasures systemically.

Coordination between headquarters and the regions in Alaska helps with effective scoping of projects, cost control, and the transition of projects from approval and funding to successful construction. ADOT&PF also uses the obligation tracking spreadsheet to identify funding that is unallocated, funding to be returned from projects constructed under bid price, and projects being held for future construction. Funds originally designated for HSIP all remain within the Alaska HSIP, providing flexibility in programming work.

Annual updates allow ADOT&PF to respond to lessons learned from previous evaluations and to adjust for emerging issues. For example, ADOT&PF identified a challenge related to the sporadic nature of incapacitating injuries and fatalities. Headquarters was able to use the process to first identify the problem and then a solution. As a result, they now combine incapacitating injuries and fatalities to help stabilize the analysis of rare crash severities.

Challenges

Headquarters updates the spreadsheets annually to reflect the latest crash costs and CMFs. ADOT&PF noted that one small challenge is ensuring the regions are using the latest version of the project evaluation spreadsheet. They currently post the latest version online with their HSIP Handbook for central access. As a final check, the central office reviews the submittals from each region and can notify the regions as needed to provide the latest version.

Contact

Matt Walker
Alaska Department of Transportation
(907) 465-6963
Matthew.Walker@alaska.gov

Accelerating HSIP Projects Using In-House Design


Rhode Island

Description

The Rhode Island Department of Transportation (RIDOT) implemented a unique process for accelerating the completion of priority signing and striping projects. This process focuses on identifying safety improvements for which in-house staff can execute the project design and was implemented based on the premise that safety improvements made more quickly will begin to reduce fatality and serious injury risks sooner. More complex projects require state procurement procedures, advertising for and hiring a design consultant, and contracting construction, and can take a year or more to complete. By contrast, improvements such as signing and striping projects can be fast-tracked to provide a swifter alternative to addressing safety issues in high-crash areas.

Beginning in 2010, RIDOT developed the Strategically Targeted Affordable Roadway Solutions (RI*STARS) program focused on delivering low-cost and high-benefit safety and mobility improvements. As part of the program, RIDOT developed and implemented a pilot project for accelerating short-term signing and striping improvements. The pilot project was so successful that RIDOT expanded it to include the delivery of quick short-term safety improvements that are part of the Highway Safety Improvement Program (HSIP).

RIDOT now uses this improved procedure to fast-track many signing and striping HSIP projects, particularly those submitted by local jurisdictions. The fast-track approach begins following the identification of safety needs through the HSIP planning process and the completion of a road safety audit (RSA). Those improvements that align with the Strategic Highway Safety Plan (SHSP) Emphasis Areas and have a benefit-cost ratio greater than one are deemed eligible for funding. The next step is to prioritize eligible project proposals based on their benefit-cost ratio, alignment with SHSP priorities, project cost range, improvement types, engineering review, and available HSIP funding. After reviewing and ranking all projects in the state, HSIP staff review and advance projects to the design stage, depending on available funding.

Projects are divided into two categories before being advanced. Short-term signing and striping projects can be advanced quickly through the RIDOT In-House Design process. Longer-term improvements are typically advanced through the HSIP Final Design process. Identifying these short-term improvements through the in-house design category enables RIDOT engineers to fast-track projects with high benefit-cost ratios and avoid a more prolonged design process.

Projects assigned to the In-House Design category are sent in the form of a work order to an in-house RIDOT engineer team. RIDOT engineers and interns perform about 30% of the design work. The other 70% is sent to on-call consultants, who have a standing task-performance agreement with RIDOT, so no new procurement process is necessary. After the signage and striping design is complete, it is sent to in-house maintenance staff or on-call striping contractors who complete the improvements accordingly.

Instead of years, the entire process for In-House Design of signing and striping projects typically takes one to two months. Municipalities and other stakeholders have seen this as a positive change, and appreciate seeing their roadway safety concerns quickly addressed. As a result, these stakeholders are more likely to stay involved in these projects, both financially and collaboratively. In addition, the relationships between many municipalities and RIDOT has improved to the point where municipalities are more engaged in reporting safety concerns and more confident that a safety-improvement response will be forthcoming.

Key Accomplishments

  • Through the RI*STARS program, the State implemented a process to accelerate the completion of HSIP signing and striping projects by using RIDOT's own staff.
  • In-house or on-call consultants complete signing and striping design in as little as a month.
  • RIDOT maintenance staff or on-call striping contractors complete the installation.

Results

RIDOT has been able to significantly accelerate the design and construction of HSIP signing and striping projects with high benefit-cost ratios. The use of in-house staff and on-call consultants for the design of these projects has shortened delivery time to one to two months. As a result, RIDOT is able to serve its municipalities and other safety stakeholders much faster and keep them involved in, and more than satisfied with, the safety improvement dialogue and process. Most importantly, it provides the public with potential life-saving safety improvements on the roads sooner.

Contacts

Sean Raymond, P.E.
HSIP Program Manager
Rhode Island Department of Transportation
Two Capitol Hill
Providence, RI, 02903
Phone: 401-222-2694 ext. 4204
Fax: 401-222-3006

Robert Rocchio, P.E.
Managing Engineer
Traffic Management
Rhode Island Department of Transportation
Two Capitol Hill
Providence, RI 02903
Phone: 401-222-2694 ext. 4206
Fax: 401-222-3006

Unique Accord in Washington State Helps State and Tribal Governments Work Proactively on Roadway Safety

The Washington practice is discussed after the following introduction about Tribal Government Involvement in the Strategic Highway Safety Plan process.

Other states in this SHSP/Tribal Government Noteworthy Practices series: MT, ND, SD


Involving Tribal Governments in the Strategic Highway Safety Plan Update Process - Approaches and Benefits

As States move toward achieving zero deaths on their roadways, the impact of motor vehicle crashes in tribal communities and on tribal roads cannot be overlooked. American Indian and Alaska Native (AI/AN) populations experience higher rates of fatalities associated with transportation than does the population as a whole. Crashes are also the leading cause of unintentional death for AI/AN ages 1-44.

Legislation requires that the SHSP is developed in consultation with major Federal, State, tribal, and local safety stakeholders (23 U.S.C.148 (a)(12)(A)). SHSPs must also consider safety needs of, and high-fatality segments of, all public roads, including non-State-owned public roads and roads on tribal land (23 U.S.C.148 (a)(12) (D)).

States and tribal governments are working together in an effort to reduce roadway injuries and fatalities in tribal communities. This includes collaborating during the State Strategic Highway Safety Plan (SHSP) process, an effort that brings together a diverse group of stakeholders to identify critical roadway safety challenges and establish potential solutions. Tribes are also developing Strategic Transportation Safety Plans of their own, which may allow access to additional resources such as the Tribal Transportation Program Safety Fund.

These noteworthy practices highlight the activities of four States and tribal communities to collaborate during and after the SHSP process. They contain several recurring themes:

  • Establishing a government-to-government relationship between State offices and tribal governments is very effective because it establishes respectful lines of communication and agreed-upon approaches that facilitates discussion on roadway safety issues.
  • Tribal involvement in the SHSP process insures tribal concerns and strategies are addressed in the SHSP.
  • Tribal safety summits are an effective platform for information-sharing among tribes on roadway safety issues and often strengthen inter-tribal relationships.
  • An established network for communicating between tribes and State agencies leads to better project coordination and delivery, lower project costs, stronger relationships, and better information sharing.

Washington

Background

Washington's Strategic Highway Safety Plan (SHSP), Target Zero®, first authored in 2000, aims to eliminate traffic fatalities and serious injuries by 2030. Based on data, Target Zero:

  • Creates goals and objectives.
  • Prioritizes the work that needs to be done to reach the goals.
  • Offers countermeasures determined by research to be proven, recommended, or unknown.

For updating and implementing Target Zero, two State agencies take the lead in engaging with stakeholders representing the varied segments of Washington's population: the Washington State Department of Transportation (WSDOT) and the Washington Traffic Safety Commission (WTSC), an independent agency that serves as the State's Governors Highway Safety Association (GHSA) Traffic Safety Office.

Tribal Government participation has been a key strategy toward achieving Target Zero goals. Based on changing data, Washington's SHSP has been updated every three years since the 2007 update to ensure Target Zero goals are on track. Tribes in Washington have been increasingly involved in SHSP planning as Target Zero has become the guide for State, regional, county, and city agencies; Tribal programs; and private sector organizations involved with transportation and traffic safety.

Washington's Centennial Accord creates a collaborative environment for transportation and traffic safety efforts among Tribes and the State of Washington. Signed in 1989, the Accord established government-to-government relations between State and Tribal governments, in an effort to resolve disagreements before they reached the courtroom. With the structure of the Accord well in place, that framework of collaboration was applied to Tribal involvement in statewide transportation and traffic safety planning.

To engage the 29 federally-recognized Tribes in SHSP updates, Washington uses the following ongoing boards and organizations:

  • Washington Indian Transportation Policy Advisory Committee (WITPAC), a WSDOT advisory committee, which meets quarterly.
  • Tribal Transportation Planning Organizations, created and hosted by WSDOT, with meetings chaired by Tribal Governments.
  • Tribal Traffic Safety Advisory Board (TTSAB), an advisory board to WTSC representing tribal leadership in the 4Es (Engineering, Education, Enforcement, and Emergency Response) of traffic safety, which meets monthly and works on education and enforcement projects.
  • Northwest Association of Tribal Enforcement Officers (NATEO), a traffic safety partner unrelated to state government, which meets semi-annually.

Inclusive Highway Safety Planning

The Centennial Accord gives State agencies a protocol for officially interacting with Tribes, which includes a requirement that agencies have a tribal liaison on staff. The transportation and traffic safety boards and organizations create a framework that is used for communicating with Tribal staff involved with education, enforcement, engineering and Emergency Medical Services (EMS).

By way of example, for the 2016 Target Zero update, WTSC sent letters through the U.S. mail to Tribal leaders asking for Tribal representatives. A sample letter was distributed via email to members of WITPAC, TTPO, TTSAB, and NATEO. The communication system netted the three requested representatives, one for the top-level Steering Committee and two for the Project Team.

This method of identifying representatives is also an example of Washington's approach toward continuous improvement with each Target Zero update. Previously, WTSC identified Tribal representatives who had been enthusiastic and actively involved in other transportation safety efforts. This shift to casting a wider net to attract participants is a more transparent, open process and is another way to remind Tribal leadership of the importance of transportation and traffic safety to the quality of life in their communities.

The current update of Washington State's SHSP is focusing in part on expanding data-driven decisionmaking in Tribal transportation projects by inviting safety data experts to present Tribal data to the advisory boards and organizations. For example, to prepare for the current Target Zero update, during a TTSAB meeting:

  • A WTSC staffer presented on Tribal fatalities (FARS) overlaid with U.S. census data by county.
  • A WSDOT staffer presented on serious injury data on reservations, enhanced by the use of GPS coordinates in crash reports.
  • A WTSC sub-grantee, currently conducting Tribal traffic safety assessments, presented on reservation fatality and serious injury data obtained from multiple sources including FARS, state collision database, CDC, Tribal police, and Tribal EMS.

Tribes will have a variety of ways to contribute to the 2016 version of Target Zero:

  • Project Team representatives have asked Tribal planners to share with the SHSP team their safety plans, most of which were developed through grants from FHWA's Tribal Transportation Program Safety Fund.
  • Tribes will be invited to the Partners' Meeting as usual. Representatives from 11 tribes attended the last Meeting.
  • When writing teams are formed more Tribal representatives will be sought.
  • When Target Zero is nearing completion, following the official consultation protocol, hardcopy drafts will be mailed to Tribal Chairs for comment. Additionally, electronic versions will be distributed for comment through the communications infrastructure of WITPAC, TTPO, TSAB, and NATEO.

When the 2016 SHSP is final, copies will be mailed to Chairs, and a link to the web version being broadly disseminated. TTSAB will distribute a news release on the 2016 version of Target Zero to the 29 Tribal newspapers and newsletters throughout Washington.

Key Challenges

All large organizations can develop silos, and Tribal government is no exception. Tribal planners work in environments that require collaboration, but it can be difficult to engage Tribal police and other programs in SHSP updates.

Data-sharing continues to be a major issue. State and Tribal planners need crash data on Tribal roads to make the case for federal and state grant money. But there are many challenges to data being freely shared between tribes and state and local highway agencies, including staffing and the resources it takes to process data. To help with the data-sharing challenge, WTSC funded an ongoing programming project that will allow each Tribe's codes to be uploaded in an automated fashion to the state's electronic ticketing and crash reporting system used by law enforcement. This will enable full functionality with a pull-down menu for jurisdiction. Tribes may choose to share only crash data with WSDOT/WTSC, which may remove some barriers to data-sharing.

Finally, limited funding is an ongoing barrier to creating Tribal educational and enforcement programs that could further Target Zero® goals and save lives on reservations.

Benefits Realized

Tribes and Washington State experience numerous benefits when Tribes are involved in SHSP updates, including the following:

  • Tribes gain increased awareness on the importance of addressing roadway safety.
  • Tribes take ownership of the final SHSP plan.
  • Tribes are more likely to use the SHSP as a guide and source of information for their own transportation plans.
  • Tribal planners, enforcement, and EMS become familiar with Target Zero strategies, which researchers have found to be effective and can be invaluable when applying for State grant funding.
  • Tribal-State and Inter-Tribal relationships are strengthened.
  • A broader understanding of the State's roadway safety requirements and needs in Washington is gained.
  • Washington's data on behavioral factors in fatal and serious injury crashes is more complete and accurate allowing for more correct analyses.

See these other SHSP/Tribal Involvement Noteworthy Practices:

Contact

MJ Haught
Tribal Liaison
Washington Traffic Safety Commission
(360) 725-9879
MJHaught@wtsc.wa.gov

The Evolution of Tribal Involvement in Montana's Road Safety Planning

The Montana practice is discussed after the following introduction about Tribal Government Involvement in the Strategic Highway Safety Plan process.

Other states in this SHSP/Tribal Government Noteworthy Practices series: ND, SD, WA


Involving Tribal Governments in the Strategic Highway Safety Plan Update Process - Approaches and Benefits

As States move toward achieving zero deaths on their roadways, the impact of motor vehicle crashes in tribal communities and on tribal roads cannot be overlooked. American Indian and Alaska Native (AI/AN) populations experience higher rates of fatalities associated with transportation than does the population as a whole. Crashes are also the leading cause of unintentional death for AI/AN ages 1-44.

Legislation requires that the SHSP is developed in consultation with major Federal, State, tribal, and local safety stakeholders (23 U.S.C.148 (a)(12)(A)). SHSPs must also consider safety needs of, and high-fatality segments of, all public roads, including non-State-owned public roads and roads on tribal land (23 U.S.C.148 (a)(12) (D)).

States and tribal governments are working together in an effort to reduce roadway injuries and fatalities in tribal communities. This includes collaborating during the State Strategic Highway Safety Plan (SHSP) process, an effort that brings together a diverse group of stakeholders to identify critical roadway safety challenges and establish potential solutions. Tribes are also developing Strategic Transportation Safety Plans of their own, which may allow access to additional resources such as the Tribal Transportation Program Safety Fund.

These noteworthy practices highlight the activities of four States and tribal communities to collaborate during and after the SHSP process. They contain several recurring themes:

  • Establishing a government-to-government relationship between State offices and tribal governments is very effective because it establishes respectful lines of communication and agreed-upon approaches that facilitates discussion on roadway safety issues.
  • Tribal involvement in the SHSP process insures tribal concerns and strategies are addressed in the SHSP.
  • Tribal safety summits are an effective platform for information-sharing among tribes on roadway safety issues and often strengthen inter-tribal relationships.
  • An established network for communicating between tribes and State agencies leads to better project coordination and delivery, lower project costs, stronger relationships, and better information sharing.

Montana

Background

The Montana Department of Transportation (MDT) began developing its Comprehensive Highway Safety Plan (CHSP) in 2006, in response to Federal surface transportation funding legislation. In developing the CHSP, it became clear from crash analyses that fatalities and serious injuries among Native Americans were disproportionately represented in Statewide fatal and serious injury crashes.

Over the past decade, Montana has also developed and adopted its long-term Vision Zero goal of eliminating deaths and injuries on its State highways. MDT's outreach to tribes concurrently grew over that time into a mutually beneficial government-to-government effort that includes education, planning, and technical support.

Evolving Tribal Involvement in Montana's Comprehensive Highway Safety Plan

Native Americans comprise 6.2 percent of Montana's population but make up about 17 percent of total motor vehicle fatalities per year. MDT is committed to consistently working with tribal planners and engineers, law enforcement, health service professionals, and other tribal representatives. These collaborations help identify strategies that can reduce fatalities and serious injuries on tribal roads, and contribute to Montana's Vision Zero goal.

The 2005 Montana Tribal Safety Conscious Planning Forum kicked off MDT's concerted collaboration on road safety with the seven land-based tribes in Montana. This forum brought together tribal leaders, the Governor of Montana, and the MDT director. This government-to-government, high-level communication was critical in achieving the forum's objective of encouraging tribes in Montana to participate in developing and updating the CHSP.

Since the forum convened, MDT's relationship with tribes has evolved to include regular communication on transportation safety issues between tribal safety representatives and MDT program managers. In addition to tribal participation in statewide annual meetings, MDT has two full-time staff who focus on tribal relations.

The cultural liaison in the State Highway Traffic Safety Section is funded by the National Highway Traffic Safety Administration. This liaison manages the Safe on All Roads (SOAR) program for traffic safety education that supports a SOAR coordinator on each reservation. These individual SOAR coordinators create and provide culture-specific messaging focused on safety awareness, education, and consequences of impaired driving, lack of occupant protection, and other risky driver behavior. MDT encourages each tribe to assign their own SOAR coordinator to help develop messages aimed at changing behavior, such as lack of seatbelt or car seat use. The SOAR coordinator positions were recommended in the CHSP.

The CHSP safety planner provides technical assistance, participating in development of tribal-led safety plans, quarterly meetings, and road safety audits. Starting in 2012, the Bureau of Indian Affairs Rocky Mountain Region Road Safety Audit Pilot Program conducted training and several road safety audits across the seven reservations. The pilot program used FHWA's Road Safety Audit Toolkit for Federal Land Management Agencies and Tribal Governments for guidance. Road safety audit programs have been included in individual tribal transportation safety plans. The CHSP safety planner also maintains relationships by proactively reaching out to tribes on a regular basis. Regular communication from these liaisons is key to maintaining tribal involvement in the CHSP, which was updated in 2015.

Montana's CHSP Update

Leading up to the CHSP update in 2014, MDT and tribal representatives collaborated and conducted four annual Tribal Transportation Safety Summits. Coordination involved providing technical support and other resources, such as venues. These summits were hosted by tribes in Montana, with rotating sponsorship each year to encourage tribal ownership over sharing road safety best practices.

Communication over years—not just when it's time to update the CHSP—leads to nuanced input for the CHSP, to strategies that have a chance of being implemented, and to reducing fatalities and serious injuries on tribal roads.

Many CHSP strategies were a result of the summit process. Others came out of the transportation safety plans each tribe developed, as required as part of FHWA Federal Lands Tribal Transportation Program beginning fiscal federal year 2013. In those plans, tribes use their own fatal and serious injury data and MDT fatality data to identify critical safety issues. While tribal safety plans tend to be more specific than the higher-level strategies in the CHSP, many tribal strategies—whether addressing impaired driving, occupant protection, lane departures, or other issues—are consistent with the emphasis areas in the CHSP. In addition, Tribal planners shared quarterly updates with MDT staff to identify opportunities for tribal safety plan development strategies to consider SOAR efforts and the CHSP update.

Tribes are now so well integrated into Montana's safety stakeholder group that separate tribal summits are no longer necessary. All seven tribes have been actively involved in the statewide annual Transportation Safety Meeting and tribal partners are also represented on CHSP committees.

Montana's 2015 CHSP update also reflects the integration of tribal issues. The CHSP update process identified several areas of overlap and determined it would be better to have fewer emphasis areas. The update no longer has 12 individual emphasis areas or a specific CHSP Native American emphasis area. Rather, tribal issues and strategies are found throughout the emphasis areas, and the emphasis areas in the CHSP are safety concerns for all Montanans.

Key Challenges

Getting tribal government leaders to discuss transportation safety was initially challenging. MDT brought those critical partners to the table by having MDT leadership connect with tribal leadership, and also offering financial assistance to cover costs of attending meetings, which underscored the importance of tribes' attendance.

Data continues to be the major challenge in Montana and other States engaging in proactive tribal outreach. Tribal traffic incident records tend to be incomplete, although fatality data is reliable because the Montana Highway Patrol responds to all fatalities on all public roads in Montana. One tribe has adopted all the State's traffic codes and consistently provides MDT with crash data. Other tribes have few traffic codes and do not consistently provide data to MDT.

Tribes in Montana are concerned about confidentiality issues when it comes to sharing data. There is also frequent turnover among tribal leadership, making it challenging for MDT to form lasting partnerships. MDT encourages better crash data by building trust with tribal representatives through consistent communication.

Benefits to Tribal Participation in the CHSP

  • Brings all Montanans closer to a cohesive goal of on Montana's roads: Vision Zero - zero fatalities, zero serious injuries.
  • Tribal issues and strategies are integrated into the CHSP emphasis areas.
  • Realizing a downward trend in Native American fatalities.
  • Participation from tribal safety representatives provides an opportunity to share best behavioral and infrastructure safety practices, and identify hurdles with other safety stakeholders.
  • Helps builds trust among state agencies, tribal governments, and other safety stakeholders.

See these other SHSP/Tribal Involvement Noteworthy Practices:

Contact

Pam Langve-Davis
Statewide and Urban Planning
CHSP Coordinator/Safety Planner
Montana Department of Transportation
(406) 444-7646
PLangveDavis@mt.gov