Background
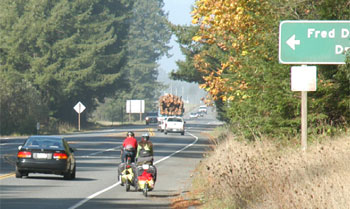
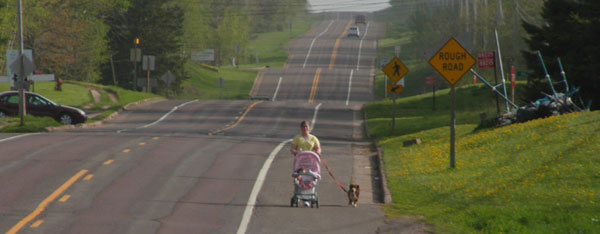
Approximately 60 percent of all road miles in the U.S. are non-Interstate, rural roads maintained and operated by local agencies, such as towns, counties, and Tribal governments.(1)Non-motorized modes of travel can be expected along these roads. Non-motorized transportation is primarily comprised of biking, walking, equestrian, and horse-drawn vehicles but may also include other non-powered transportation devices.


This guide focuses on pedestrian and cyclist safety on rural roadways. Cyclists must travel in the same direction as other vehicular traffic, while pedestrians should typically walk against traffic.
Many non-motorized travelers face daily challenges and safety concerns when utilizing the same roadway as motorized travelers, making the non-motorized users especially vulnerable when a crash occurs. While this may be particularly evident within small communities situated along rural highways, the needs of non-motorized users on undeveloped portions of rural highways may not be clearly understood. Recognizing and addressing non-motorized challenges and safety on local rural roads is an important step in improving safety for all road users.
Purpose
The purpose of this guide is to assist local rural road practitioners in making effective use of current practices and resources addressing non-motorized mobility and safety, thereby creating a more accommodating and viable transportation system for all road users. Local practitioners may be road supervisors, street superintendents, engineers, planners, local officials, law enforcement officers, or others who are responsible for the rural road transportation network. While this document will provide guidance on addressing non-motorized safety, other resources—many of which are referenced in this document—may need to be consulted to address the varying and often unique safety issues affecting non-motorized users on rural roads. The specific objectives of this guide are as follows:
- Describe a process that can be used to address the safety of non-motorized users on local rural roads.
- Explain the significance of non-motorized transportation safety on local rural roads.
- Communicate the primary factors affecting non-motorized safety on local rural roads.
- Establish a concise "toolbox" of resources and information for addressing non-motorized safety concerns.
- Provide evaluation methods for locally-implemented initiatives.
This document focuses on low-volume local rural roadways (also known as rural highways) that typically pass through undeveloped or agricultural land. However, such roadways may be dotted with small commercial areas, towns, or other small activity centers. In this guide, these areas will be referred to as "rural villages." Neighborhood streets are not the focus of the document.
Understanding the Non-Motorized User Safety Issue
Identifying potential factors affecting the safety of non-motorized users on rural roadways is important to help understand non-motorized roadway users' risk. In 2009, more than 1,500 persons were killed in crashes involving a motororized and non-motorized user on rural roads in the U.S., with nearly one-quarter (368) of those occurring on local rural roads. Pedestrians were killed in approximately 83 percent (1,252) of all rural crashes involving a non-motorized user, and bicyclists were killed in approximately 14 percent (204) of these crashes. In the study Pedestrian and Bicycle Crash Types of the Early 1990's , it is shown that, while crashes involving pedestrians and bicyclists that result in a fatality are typically reported, less serious crashes are more frequent and underreported.(2)
Rural pedestrian crashes are nearly twice as likely to result in a fatality and rural bicycle crashes are three times as likely to result in a fatality compared to urban crashes. (From UNC Highway Safety Research Center, 2006)
Occupants of other types of non-motorized transport devices, such as persons on personal conveyances—including ridden animals and horse-drawn vehicles (skaters, skateboarders, scooters, and segways are also included in this category)—were killed in approximately three percent of the rural crashes involving a non-motorized user.(3) While constituting a relatively small percentage nationally, these crashes are likely to have regional significance, particularly in rural communities where the use of horse-drawn vehicles are more ordinary. Ohio, for example, is home to the country's largest Amish population, most of whom do not use automobiles. Crash data from 1990-1997 revealed an average of 64 horse-drawn vehicle crashes in the State annually, approximately one percent of which resulted in a fatality.(4) Horseback-riding may also be a common activity along rural roadways. Despite the relatively low frequency of equestrian and horse-drawn vehicle crashes, the safety of these non-motorized roadway users should not be overlooked, and measures to address the most significant causal factors should be considered.
Factors Affecting Crash Risk
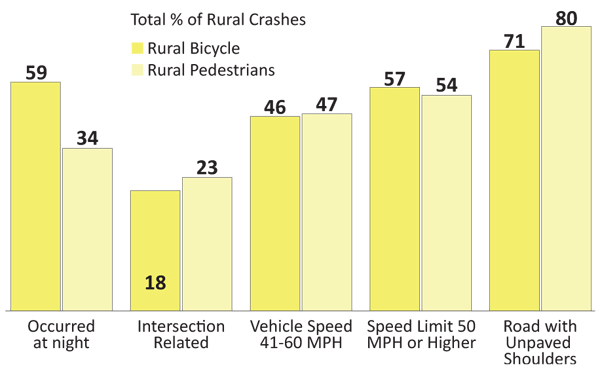
There are a number of factors impacting the safety of non-motorized roadway users in rural areas. According to Factors Contributing to Pedestrian and Bicycle Crashes on Rural Highways, rural pedestrian crashes are nearly twice as likely to result in a fatality and rural bicycle crashes are three times as likely to result in a fatality as urban crashes of like type.(5) Two-lane roads comprise the majority of rural roads, exhibit the greatest number of rural bicycle and pedestrian crashes, and have the highest overall crash frequency. The analysis of rural non-motorized crashes (see Figure 1) performed during the Hunter et al study indicates common conditions where crashes involving a motorized vehicle and a pedestrian or a cyclist on rural roads may occur include the following:
- Two-lane roadways.
- Nighttime conditions (for pedestrian crashes).
- Non-intersection-related.
- Relatively high vehicle speeds.
- Absence of shoulders along the roadway (and other space constraints).
Figure 1. Common Conditions for Vehicle-Pedestrian and Vehicle-Cyclist Crashes on Rural Roads.(6)
There is a significant difference between pedestrian and bicycle crashes by day versus night. A majority of rural pedestrian crashes occurred during nighttime hours (59 percent), while, the majority of rural bicycle crashes occurred during daytime hours (66 percent).
Both rural bicycle and pedestrian crashes were significantly more common at non-intersection locations. The study revealed that the most common crash type involving pedestrians on rural roads was "walking along the roadway," which represented 26 percent of the total pedestrian crashes.(6) The most common rural crash types for bicyclists generally occurred at non-intersection locations and were almost evenly split between "motorist overtaking bicyclist," which accounted for approximately 24 percent of the crashes, and "bicyclist turn/merge into path of motorist," which accounted for approximately 22 percent of the crashes.
Speeding
Relatively high vehicle speeds are also a contributing factor to rural bicycle and pedestrian crashes and fatalities. More than half of all rural pedestrian and bicycle crashes occur on roads with a posted speed limit of 50 mph or greater. Nearly half of rural pedestrian and bicycle fatalities occur with vehicle speeds between 41 and 60 mph. As shown in Figure 2, the probability of a pedestrian fatality as a result of a collision with a vehicle increases from 5 percent to 85 percent as vehicle speed increases from 20 mph to 40 mph. In short, rural crashes are more likely to result in fatalities for non-motorized users than urban crashes because speed is a major contributing factor.
Figure 2. Pedestrian Fatality Rate Based on Speed of Vehicle.(7)
Speed also affects a driver's ability to identify and react to a potential conflict. The stopping distance is the total distance it takes for a driver to identify and react to a safety hazard in the vehicle path—the reaction distance—and then bring the vehicle to a complete stop—the braking distance. As shown in Figure 3, as a vehicle's speed increases, the distance required for it to stop also increases. Furthermore, it is paramount that motorized and non-motorized users understand each other's intent. For instance, motorized vehicles have turn signals and brake lights to help drivers communicate what they intend to do, but non-motorized forms of transportation may present challenges for users to communicate with others. Communicating and understanding that intent is especially challenging at faster speeds.
Figure 3. Stopping Distance for Vehicles.
Unpaved Shoulders
In a study conducted by the University of North Carolina Highway Safety Research Center, it was shown that the majority of rural bicycle and pedestrian crashes occurred on roads with unpaved shoulders, accounting for 71 percent of pedestrian crashes and 80 percent of bicycle crashes.(8) Roadways with unpaved shoulders are a significant concern in rural contexts. Rural roads without shoulders lack separation between motorized and non-motorized users. Pavement edge drop-offs can also be problematic, especially for cyclists, since they can cause a cyclist veering off the roadway to lose control and crash. Additionally, space constraints along rural roadways can be caused by exposed roadside hazards and poor pavement conditions.
Behavioral Factors
Behavior plays a major role in non-motorized crashes. It is critical to understand how the roadway environment and roadway user characteristics interact within the context of the surrounding community, especially as land use or travel habits and patterns change over time. The following behavioral factors affect the safety of non-motorized users:
- Motorists' expectancy of encountering non-motorized users, especially in undeveloped areas, is typically low. As a result, motorists' actions may not facilitate safe interactions with non-motorized road users. For example, drivers who are focused solely on vehicular traffic and associated traffic controls may not give the appropriate attention to non-motorized users. At intersections, drivers typically look in locations and directions where there is conflicting vehicular traffic and may not notice non-motorized users.
- Improper riding or walking habits (e.g., riding against traffic or walking with traffic) are also behaviors that affect safety. Various studies demonstrate that the likelihood of a pedestrian crash is reduced by a factor of between 1.5 to 4 times when walking against traffic. A Study of Fatal Pedestrian Crashes in Florida conducted by the University of South Florida's Center for Urban Transportation Research (CUTR) indicates that a disproportionate ratio of "pedestrian walking along the roadway" crashes involve pedestrians walking with traffic (approximately 3 to 1).(9) Similarly, the study Pedestrian and Bicycle Crash Types of the Early 1990's found cyclists riding against traffic have been shown to increase the risk of a crash. Improper riding and walking habits may result from inadequacies in infrastructure and should not be dismissed as unrelated to the functional characteristics of the roadway.
- Non-motorized users, particularly pedestrians and cyclists, tend to travel along the most direct route possible. If crossings do not provide safe and accessible routes that directly connect the destinations people want to reach, many non-motorized users may cross roadways outside of crosswalks. A crosswalk is the extension of the sidewalk or the shoulder across the intersection, regardless of whether it is marked or not. Most jurisdictions have crosswalk laws that make it legal for pedestrians to cross the street at any intersection, whether marked or not, unless the pedestrian crossing is specifically prohibited.

Many crashes involving non-motorized users relate to them sharing the same space along the roadway with motor vehicle traffic. Paved shoulders provide separated space for motorized and non-motorized users along the roadway and have been shown to be an effective countermeasure in reducing all crash types.
Roadway Context
Local rural roads may pass through a variety of settings ranging from rural undeveloped areas to rural villages, small towns, or largely isolated subdivision developments. These land use patterns can have a significant impact on non-motorized safety. The type of development within rural communities significantly contributes to non-motorized crashes and their severity on rural roads.(10) For example, rural communities undergoing development, located near other developed areas, or experiencing demographic shifts should consider whether or not the roadway characteristics are compatible with the current or future users, including non-motorized transportation.
Applying a Systemic Approach
The challenge in addressing non-motorized safety in rural areas is that crashes involving non-motorized road users tend to be widely dispersed . The significant number of lane-miles and the dispersed nature of crashes make it difficult to target specific locations for assessment and improvement. Therefore, applying a systemic approach to addressing the safety of non-motorized users is beneficial to proactively address widespread safety issues and cost-effectively minimize crash potential. Rather than focus on specific crash locations, a systemic approach targets common risk factors in crashes throughout the roadway network. A systemic improvement is one that is widely implemented based on high-risk roadway features that are correlated with particular crash types rather than crash frequency. The systemic problem identification entails a system-wide crash analysis targeting specific crash characteristics at the system level. For example, an evaluation of rural crash data may reveal crashes involving cyclists riding against traffic and motorized traffic exiting driveways on a corridor. Rather than target the specific locations where crashes occurred, the systemic approach identifies the risk factors associated with all of the crashes along the corridor and addresses the risk on a corridor basis (at locations that already experienced crashes and those with similar charateristics having the potential for similar crashes).
Using this Guide
This guide is intended to provide information, tools, and resources that can assist the local practitioner in addressing non-motorized mobility and safety on local rural roads. The material presented will help the local practitioner with understanding common conditions and behaviors, assessing these conditions and behaviors, implementing appropriate countermeasures, and evaluating the effectiveness of these countermeasures. Each local area is unique, and there is no "one-size-fits-all" approach to addressing and improving non-motorized roadway safety. This document presents a general process that can be followed to identify potential problem areas and develop targeted strategies. The four-step process is shown in Figure 4.
|
Stakeholder Involvement and Communication Utilized Throughout |
|---|
| Step 1: Identify Factors Affecting Non-Motorized Safety |
|
1. Get Started
2. Assemble Data
3. Engage Stakeholders 4. Organize Data
|
| Step 2: Assess Factors Affecting Non-Motorized Safety |
|
1. Define the Problem
2. Analyze the Data
3. Prioritize Concerns |
| Step 3: Select and Implement Countermeasures |
|
1. Select Countermeasures
2. Identify Funding Sources 3. Implement Countermeasures |
| Step 4: Follow-up and Evaluate |
|
1. Track Countermeasures 2. Evaluate Effectiveness |
Figure 4. The Four-Step Process for Addressing Non-Motorized Issues.
The guide is organized into four sections that follow the four-step process.
Section 1 introduces the types of data that can be used to define and understand conditions and behaviors affecting non-motorized safety. Also discussed is the subject of engaging stakeholders, such as local law enforcement and regional, county, or local engineering staff, who can provide firsthand knowledge of the area and of existing safety issues.
Section 2 discusses how to assess the factors affecting non-motorized safety. Key points covered in this section include conducting an analysis of data and conducting a field assessment, as well as prioritizing non-motorized users' safety concerns.
Section 3 explores the selection and implementation of countermeasures that consider the 4 Es of safety (education, enforcement, engineering, and emergency services). It outlines considerations in selecting the appropriate countermeasures and tools to assist with the selection. Examples that illustrate how local agencies may address non-motorized transportation safety are also presented.
Section 4 includes methods to follow-up on the implementation of countermeasures and evaluate their effectiveness. The evaluation considers methods such as obtaining feedback from stakeholders and conducting before-and-after studies.
Section 5 provides a summary of the outlined process to improve non-motorized transportation safety.
Appendix A presents potential countermeasures that can be used to address non-motorized safety issues including roadway, crossing, and speeding problems. Appendix B includes Web links to publications that provide detailed information on identifying safety issues and selecting appropriate countermeasures.


