Excerpt from First Progress Report of the Highway Cost Allocation Study
The following is an excerpt from First Progress Report of the Highway Cost Allocation Study (Letter from Secretary of Commerce, February 28, 1957, GPO, House Document No. 106, 85th Congress, 1st Session.
General Growth of Travel
In the earlier days of our Federal-aid roadbuilding program, automobile travel expanded much more rapidly than our national economy. From 1920 to 1936, for example, travel by motor vehicles of all types increased from about 45 billion to about 252 billion vehicle-miles, an increase of 460 percent. During this same period the increase in gross national product has been estimated to have been only about 40 percent. The reason for this rapid expansion in motor-vehicle travel was progress in the completion of a connected system of surfaced roads with concurrent development of the motor vehicle itself.
Since 1936, except for the period affected by wartime activities and restrictions, motor-vehicle travel and the gross national product have increased at about the same rate. The increase from 1936 to 1955 was 139 percent of vehicle-miles of motor-vehicle travel and 126 percent for the gross national product. Figure 1 shows the 1936-55-trend for gross national product, vehicle-miles of motor-vehicle travel, motor vehicles registered and motor fuel consumed. The curves are brought together in 1950 and, except for the war period and a few years thereafter, they lie very close together throughout. The slight dip in the gross national product which occurred in 1954 did not affect motor-vehicle usage appreciably, so the curves pertaining to motor vehicles have risen slightly above the curve for gross national product.
Figure 1. Total travel, motor-vehicle registration, motor-fuel consumption, and gross national product, 1936-55, as percentages of the respective amounts in 1950.
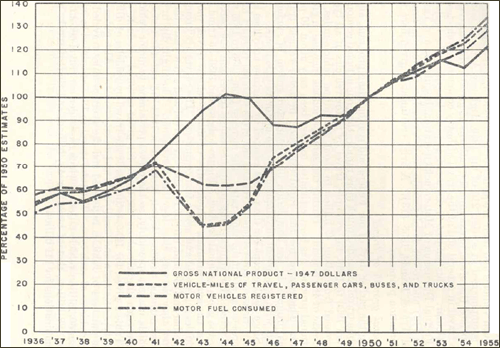
Table 2 gives, for 1955, estimates of the travel by vehicles of different types on main and local roads and on city streets. Also given are the numbers of vehicles registered and the average miles traveled by the vehicles of each type. The total travel in 1955 amounted to more than 603 billion vehicle-miles, of which passenger-car travel accounted for 488 billion, that of buses for 4½ billion, and that of trucks and combinations for 111 billion.
| Year | Motor - vehicle travel | Number of registered vehicles1 | Average travel per vehicle | ||||
|---|---|---|---|---|---|---|---|
| Main rural road travel | Local rural road travel | Total rural travel | Urban travel | Total travel | |||
| Million vehicle miles | Million vehicle miles | Million vehicle miles | Million vehicle miles | Million vehicle miles | Thousands | Miles | |
| Passenger cars2 | 178,732 | 84,356 | 263,088 | 224,452 | 487,540 | 52,092 | 9,359 |
| Buses: Commercial | 1,152 | 300 | 1,452 | 1,804 | 3,256 | 96 | 34,035 |
| School and nonrevenue | 623 | 504 | 1,127 | 124 | 1,251 | 159 | 7,836 |
| All buses | 1,775 | 804 | 2,579 | 1,928 | 4,507 | 255 | 17,658 |
| All passenger vehicles | 180,507 | 85,160 | 265,667 | 226,380 | 492,047 | 52,347 | 9,400 |
| Trucks and combinations | 47,481 | 23,005 | 70,486 | 40,901 | 111,387 | 10,413 | 10,697 |
| All vehicles | 227,988 | 108,165 | 336,153 | 267,281 | 603,434 | 62,760 | 9,615 |
- Registration figures differ slightly from those in Bureau of Public Roads table MV - 1 because of adjustments in classification in a few States.
- Includes taxicabs.
Differential Growth of Truck Travel
Considering the whole period from 1936 to 1955, travel by trucks and truck combinations has increased more rapidly than that by passenger-carrying vehicles. The vehicle-miles increase over this period was 171 percent for trucks and truck combinations, compared to 139 percent for all motor vehicles. In 1955 truck travel constituted 18.5 percent of the total motor-vehicle travel, compared to 16.3 percent in 1936. For the last 5 years of this period, however, travel by passenger cars expanded somewhat more rapidly than travel by commercial vehicles.
Table 3 gives comparisons of vehicle-miles of travel by motor vehicles of different types for the years 1940, 1945, 1950, and 1955. From 1940 to 1950, the increase in vehicle-miles of travel was 81 percent for trucks and truck combinations and 46 percent for passenger cars. From 1950 to 1955, it was 23 percent for trucks and truck combinations and 34 percent for passenger cars.
| Year | All vehicles, vehicle - miles | Passenger cars | Buses | Trucks and combinations | |||
|---|---|---|---|---|---|---|---|
| Percentage of all vehicles | Vehicle - miles | Percentage of all vehicles | Vehicle - miles | Percentage of all vehicles | Vehicle - miles | ||
| Millions | Millions | Millions | Millions | ||||
| 1940 | 302,188 | 82.60 | 249,604 | 0.88 | 2,657 | 16.52 | 49,927 |
| 1945 | 250,173 | 80.02 | 200,199 | 1.53 | 3,832 | 18.45 | 46,142 |
| 1945:1940 ratio | .83 | .97 | .80 | 1.74 | 1.44 | 1.12 | .92 |
| 1950 | 458,246 | 79.35 | 363,613 | .89 | 4,081 | 19.76 | 90,552 |
| 1950:1945 ratio | 1.83 | .99 | 1.82 | .58 | 1.06 | 1.07 | 1.96 |
| 1950:1940 ratio | 1.52 | .96 | 1.46 | 1.01 | 1.54 | 1.20 | 1.81 |
| 1955 | 603,434 | 80.79 | 487,540 | .75 | 4,507 | 18.46 | 111,387 |
| 1955:1950 ratio | 1.32 | 1.02 | 1.34 | .84 | 1.10 | .93 | 1.23 |
| 1955:1945 ratio | 2.41 | 1.01 | 2.44 | .49 | 1.18 | 1.00 | 2.41 |
| 1955:1940 ratio | 2.00 | .98 | 1.95 | .85 | 1.70 | 1.12 | 2.23 |
From the point of view of its effects on highway costs, the important thing about the truck movement is the steady increase in the proportion of heavy vehicles. In considering this question, the discussion much, at this time, be confined to main rural roads, because detailed truck studies have, so far, been confined largely to such roads. These studies are being extended to local rural roads and city streets so that the analysis in the final report called for by section 210 [of the Federal-Aid Highway Act of 1956] will be representative of a variety of conditions.
Main rural roads, as the term is used in this study, consist of the entire Federal-aid primary rural system (including the interstate) and other primary State highways, including toll roads, outside of cities; and aggregate 13 percent of the total rural road mileage of 3,030,000. In 1955, truck travel on these roads amounted to 47.5 billion vehicle-miles, which was 67 percent of the total truck travel on all rural roads, and 43 percent of such travel on all roads and streets.
From 1936 to 1955, travel by all trucks and truck combinations on main rural roads increased 208 percent, while travel by truck combinations, which are the heavier vehicles used by commercial haulers, increased 455 percent. The combinations accounted for 17.9 percent of the total truck vehicle-mileage on main rural roads in 1936, and 323.3 percent in 1955. The steady increase in the proportion of combinations in the truck traffic on main rural roads is shown by the following tabulation:
| YEAR | TRUCK COMBINATIONS (PERCENT OF ALL TRUCKS) |
|---|---|
| 1936 | 17.9 |
| 1940 | 20.9 |
| 1945 | 28.1 |
| 1950 | 31.6 |
| 1955 | 32.2 |
These and other relations pertaining to the vehicle-miles of travel on main rural roads by truck combinations and other types of vehicles are shown in table 4 for the years 1940, 1945, 1950, and 1955.
| Year | All vehicles, vehicle - miles | Passenger cars and buses | All trucks and truck combinations | Single - unit trucks | Truck combinations | ||||
|---|---|---|---|---|---|---|---|---|---|
| Percentage of all vehicles | Vehicle - miles | Percentage of all vehicles | Vehicle - miles | Percentage of all trucks and truck combinations | Vehicle - miles | Percentage of all trucks and truck combinations | Vehicle - Miles | ||
| Millions | Millions | Millions | Millions | Millions | |||||
| 1940 | 109,815 | 80.80 | 88,715 | 19.20 | 22,100 | 79.10 | 16,699 | 20.90 | 4,401 |
| 1945 | 85,792 | 78.00 | 66,885 | 22.00 | 18,907 | 71.90 | 13,602 | 28.10 | 5,305 |
| 1945:1940 ratio | .78 | .97 | .75 | 1.15 | .90 | .91 | .81 | 1.34 | 1.21 |
| 1950 | 174,349 | 77.20 | 134,527 | 22.80 | 39,822 | 68.40 | 27,257 | 31.60 | 12,565 |
| 1950:1945 ratio | 2.03 | .99 | 2.01 | 1.04 | 2.11 | .95 | 2.00 | 1.12 | 2.37 |
| 1950:1940 ratio | 1.59 | .96 | 1.52 | 1.19 | 1.90 | .86 | 1.63 | 1.51 | 2.86 |
| 1955 | 227,988 | 79.20 | 180,507 | 20.80 | 47,481 | 67.80 | 32,173 | 32.20 | 15,308 |
| 1955:1950 ratio | 1.31 | 1.08 | 1.34 | .91 | 1.19 | .99 | 1.18 | 1.02 | 1.22 |
| 1955:1945 ratio | 2.66 | 1.02 | 2.70 | .95 | 2.51 | .94 | 2.37 | 1.15 | 2.89 |
| 1955:1940 ratio | 2.08 | .98 | 2.03 | 1.08 | 2.25 | .86 | 1.93 | 1.54 | 3.48 |
Ton-Miles of Carried Load
Because of the increased use of vehicles of heavier type, the growth in the movement of goods by truck has been far greater than the growth of truck vehicle-miles. Figure 2 shows the ton-miles of carried load by trucks and truck combinations on main rural roads in each year from 1936 to 1955, inclusive. In 1936, truck hauling on main rural roads amounted to 28 billion ton-miles. In 1955 it amounted to 154 billion ton-miles, an increase of 450 percent, compared to an increase of 208 percent in truck vehicle-mileage.
Figure 2. Ton-miles carried by trucks and truck combinations on main rural roads, 1936-55.
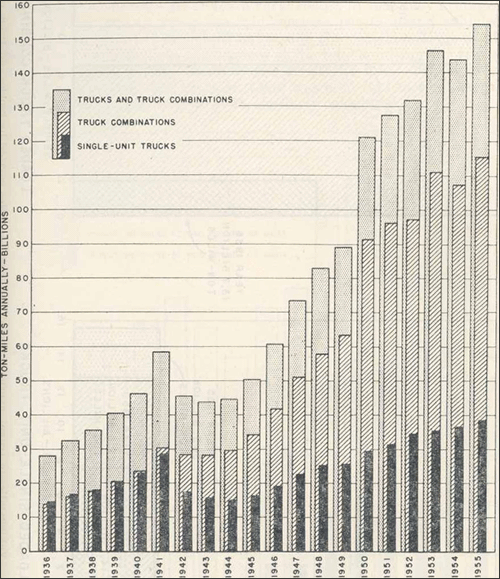
In 1936, slightly less than half of the ton-mileage was by combination, whereas in 1955, slightly over three-quarters of it was by this heavier type of vehicle. Stated in another way, in 1936 the ton-mileage moved by combinations was slightly less than that by single-unit trucks, whereas in 1955 it was three times as great.
The growth in ton-mileage by single-unit trucks and truck combinations from 1936 to 1955 is illustrated in another manner in figure 3. Ton-mileage is the product of the vehicle-mileage traveled by loaded vehicles and the average tonnage carried per vehicle. This chart shows the changes that have taken place in each of these factors. The horizontal scale measures the vehicle-mileage for loaded vehicles of each type, and the vertical scale measures the average carried load. Ton-mileage, the product of these two factors, is represented by the areas of the rectangles.
Figure 3. Vehicle-miles of travel, average carried load, and ton-miles carried by trucks and truck combinations on main rural roads in 1955 compared with 1936 and 1950.
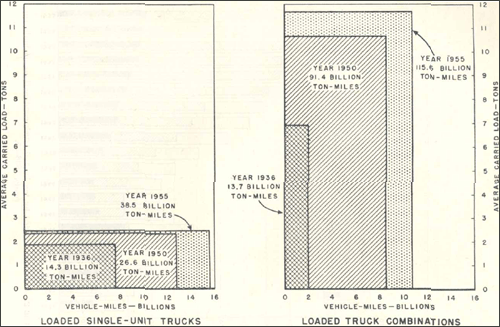
For single-unit trucks, the increase in ton-mileage from 14.3 billion in 1936 to 38.5 billion in 1955 came about mainly through an increase in the mileage traveled by loaded vehicles, since there was very little increase in the average carried load for this class of vehicles, especially from 1950 to 1955. For truck combinations, the increase in ton-mileage from 13.7 billion in 1936 to 115.6 billion in 1955 was the result of a substantial increase in the average carried load and a much greater proportional increase in mileage traveled by loaded vehicles.
Frequency of Heavy Gross and Axle Loads
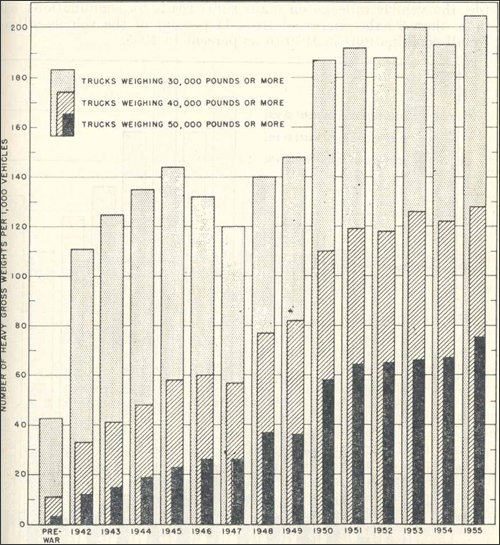
The increasing frequency of heavy loads on main rural roads is shown more directly by figure 4. In 1936, vehicles with a gross weight of 50,000 pounds or more averaged only 3 per thousand trucks and combinations encountered on main rural roads; in 1955 they averaged 75 per thousand, a twenty-five fold increase per thousand vehicles. But, since there was a threefold increase in the vehicle-mileage of all trucks and combinations, the increase in the vehicle-mileage by trucks weighing 50,000 pounds or more was 3 X 25=75-fold. For vehicles weighing 40,000 pounds or more, there was a 35-fold increase in the vehicle-mileage from 1936 to 1955, similarly calculated.
Figure 4. Number of gross loads of 30,000, 40,000, and 50,000 pounds or more, per 1,000 loaded and empty trucks and truck combinations, on main rural roads in the summers of 1942-55 and a pre-war year.
From the point of view of highway costs, the frequency of heavy axleloads is of more significance than the frequency of heavy gross loads. Figure 5 shows the number of heavy axleloads per thousand trucks and combinations for the 1936-41 prewar period and by years from 1942 to 1955. Here the picture is somewhat more encouraging. Heavy axleloads increased in frequency very rapidly from the prewar period to 1948. However, from 1948 to 1950 there was a leveling off and from 1950 to 1954 a substantial decline in the frequency of heavy axleloads in the three categories shown.
Figure 5. Number of axles weighing 18,000, 20,000, and 22,000 pounds or more, per 1,000 trucks and truck combinations, on main rural roads in the summers of 1942-55 and a pre-war year.
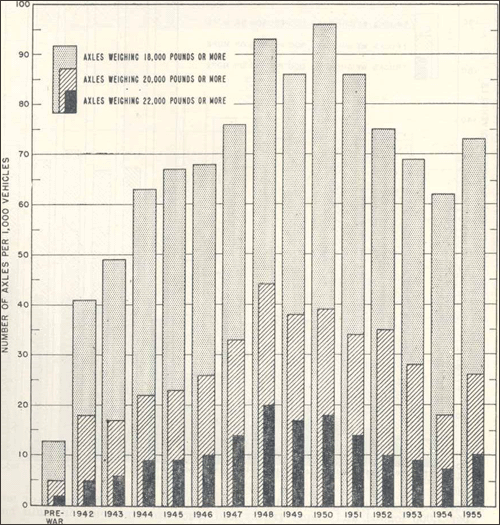
The decline in the frequency of heavy axleloads from 1950 to 1954 while the frequency of heavy gross loads was increasing may seem surprising. It may have been due, in part, to stricter enforcement of State laws pertaining to axleloads. However, it was undoubtedly due, in substantial degree, to a trend on the part of the trucking industry toward the use of vehicles with a larger number of axles. For example, the vehicle mileage on main rural roads by combinations with more than 3 axles increased from 41 percent of the vehicle-mileage by all combinations in 1950 to 58 percent in 1955.
The reason for the increase in heavy axleload frequency from 1954 to 1955 is not yet entirely clear. It is believed to be due, at least in part, to an increasing tendency on the part of the States to allow a tolerance over the stated axleload limit. Further studies, to be made this year, should show whether this constitutes the beginning of a new upward trend in heavy axleload frequencies or only a temporary irregularity.
Of approximately 388,000 miles of main rural roads in the United States, the 216,000 miles of Federal-aid primary highways are by far the most important segment, including as they do the rural portions of the Interstate System and many other heavy-traffic roads. The improvement to the most modern standards of the interstate highways, both rural and urban, will attract high volumes of both passenger-car and commercial traffic. It is on these highways, therefore, that the highest frequencies of heavy gross and axle loads will be found. Other Federal-aid primary highways, also to be improved to adequate standards, will attract heavy commercial vehicles in perhaps equal or even greater proportions, but in far less frequencies because of the generally lower levels of traffic volume. Therein lies the important of the effort, in this study, to provide the basis for an equitable apportionment, among vehicles of different sizes and weights, of the motor-vehicle tax responsibility for support of the Federal highway program.
