USA Banner

Official US Government Icon

Official websites use .gov
A .gov website belongs to an official government organization in the United States.

Secure Site Icon

Secure .gov websites use HTTPS
A lock ( ) or https:// means you’ve safely connected to the .gov website. Share sensitive information only on official, secure websites.

U.S. Department of Transportation U.S. Department of Transportation Icon United States Department of Transportation United States Department of Transportation

Roadway Departure

Jones/Linn County Portland Cement Concrete Pavement Overlay With Safety Edge ℠

Original publication: National Roadway Safety Awards: Noteworthy Practices Guide; 2011


Description of Practice

An Iowa State University study found that a pavement edge drop-off may have been a contributing factor in approximately 18% of rural run-off-the-road crashes on paved roadways with unpaved shoulders. They also found that pavement edge drop-off-related crashes were twice as likely to result in fatalities as other crash types on similar roadways. Safety Edge℠ was installed on a 2.7 mile stretch of roadway which had been previously identified as a “High Risk Rural Road” and the agency evaluated the constructability, quality, and performance of the project.

Key Accomplishments and Results:

  • Installation of 6-inch unbonded Portland cement concrete (PCC) overlay placed of an existing 6-inch PCC pavement. Overlay included two 11-foot lanes with tied 2-foot shoulders plus a 9-inch wide, 30-degree sloped Safety Edge℠ in both eastbound and westbound directions.
  • Crash reduction factors indicate that the use of Safety Edge℠ has the potential to reduce crashes by 5.7 percent and may provide additional pavement edge stability improving overall pavement life.

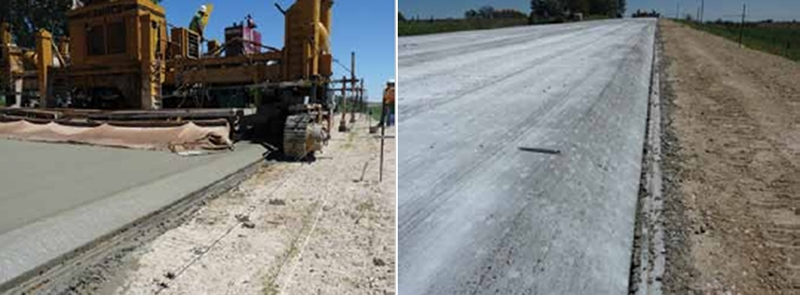
"Two photographs: (1) a construction crew lays down a road surface with a Safety Edge and (2) the a finished road with a Safety Edge"

Contacts

Mike McClain
Jones County Secondary Roads Department
319-462-3785
engineer@co.jones.ia.us

Steve Gannon
Linn County Secondary Roads Department
319-892-6400
Steve.Gannon@linncounty.org

Mississippi Cable Median Barrier Safety Initiative

Original publication: National Roadway Safety Awards: Noteworthy Practices Guide; 2011


Description of Practice

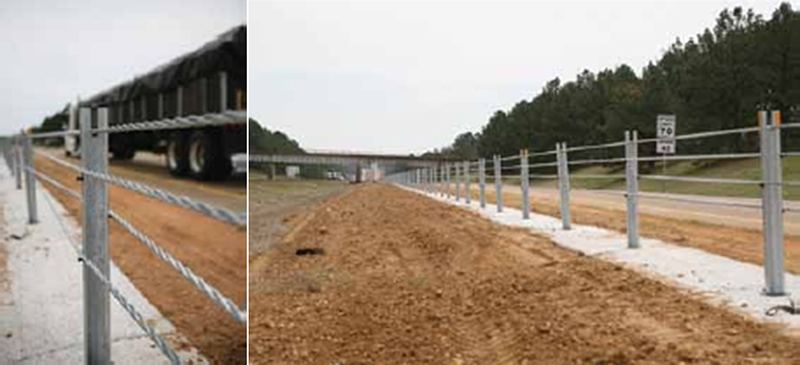
State DOT recognized certain corridors as having high occurrence of median-crossover crashes. Mississippi launched a cable median barrier safety initiative. Program piloted in early 2000's showed immediate and significant reduction in crash severity and zero cross-median fatalities.

Key Accomplishments and Results:

  • Immediate reduction in crash severity on segment with long history of high crash rates
  • Widespread public support
  • Outstanding return on investment
  • Multiple cable median barrier projects have resulted in immediate reduction of fatalities and the severity of crashes.

"Two photographs of cable median barriers along the road's edge"

Contact

Jim Willis
Mississippi Department of Transportation
601-359-1454
JCWillis@mdot.state.ms.us

Using Micro Surfacing to Reduce Wet Weather Crash Rates

Original publication: National Roadway Safety Awards: Noteworthy Practices Guide; 2011


Description of Practice

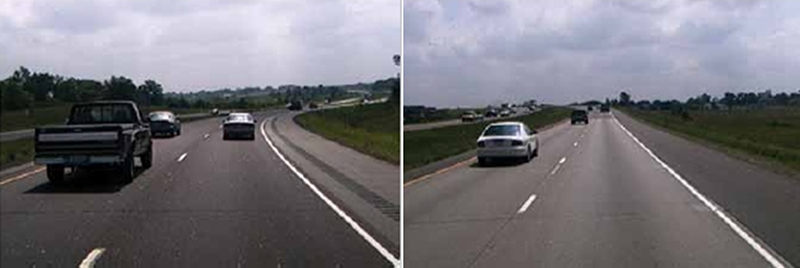
Bridges in Minnesota were experiencing a higher crash rate than the surrounding highways. Super-elevated curve geometry was suspected in causing intensified icing and wet weather crashes. Minnesota Department of Transportation (MnDOT) experimented with using micro surfacing to reduce crash rates.

Key Accomplishments and Results

  • Utilized micro surfacing to address wet weather crashes
  • 76% reduction in wet weather crashes after placing micro surfacing
  • 19% reduction in total crashes after placing micro surfacing
  • 14:1 payback ratio at 5 year life, 19.7:1 with 7 year life

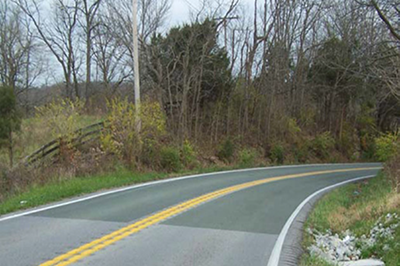
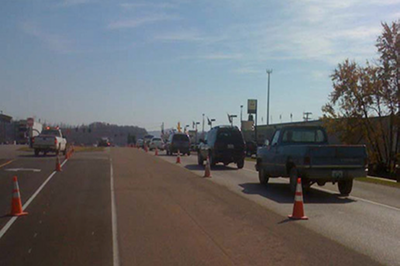
"Two photographs of two-laned highways: the highway on the left is curved and the highway on the right is straight"

Contact

Thomas J. Wood
MnDOT District 3B and Office of Materials and Road Research
651-366-5573
Thomas.Wood@state.mn.us

Raised Pavement Markers (RPMs) – A Low-Cost Alternative for Run-off-the-Road Crashes

Original publication: 2013 National Roadway Safety Awards Noteworthy Practices Guide; FHWA-SA-14-002; 2013


"Two photographs of a curve with 20 feet RPM spacing, one during the day and one at night. The photograph at night shows the markers reflecting light."

Example of 20 feet RPM spacing for a curve.

Example of same location at night.

Describe the roadway safety situation or state before the new practice was implemented. What was the safety issue, problem, or gap?

With help from the Federal Highway Administration (FHWA) and Alabama Department of Transportation (ALDOT), Mobile County, Alabama determined that 10 rural roadways within the county rated the highest in the State for run-off-the-road crashes. These roadways, totaling more than 68 miles, had experienced 224 run-off-the-road type crashes between 2005-2008, resulting in 7 fatalities and 152 injuries.

What were the key challenges that needed to be addressed before the new practice could be implemented?

The challenge was to determine the most effective low-cost treatment. While rumble strips can reduce run-off-the-road crashes, installing them requires large machinery, manpower with technical skills, and oftentimes additional right of way, making them a cost-prohibitive solution.

Describe the new practice:

To counter these cost concerns, Mobile County and ALDOT implemented a program for the systematic application of raised pavement markers (RPM) to improve sight distance recognition and guidance along the edge of the pavement, especially during wet weather conditions at night. One-directional, white RPMs adjacent to the white edge-line stripe were easily installed using existing traffic maintenance department equipment and manpower.

What technical and/or institutional changes resulted from the new practice?

The program set guidelines for consistent implementation for all roadways within the county. RPMs were placed just outside the existing edge-line stripe.

  • Tangent sections of roadways would have RPMs installed at 80 feet spacing.
  • At the approach to a curve having an advance warning curve sign, the spacing would be 40 feet apart from sign location to the beginning of the curve.
  • In the curve, the spacing would be 20 feet until reaching the tangent section.

What benefits were realized as a result of the practice?

Based on 2009-2012 crash data, crashes on the initial 10 roadways treated dropped from 224 to 33, from 7 fatalities to 0, and from 152 injuries to 10. The average number of crashes for all 10 roadways decreased by 85.3 percent. RPMs give critical guidance to drivers, especially along dark and rainy county roadways. As a result of this pilot project, they are now included in most roadway projects in Alabama.

Is the practice you are submitting from a larger report, journal, or other document? Yes

2013 National Roadway Safety Awards Noteworthy Practices Guide
Publication FHWA-SA-14-002

Contact

James Foster
Mobile County Engineer Office
251-574-8595
JFoster@mobilecounty.net

FHWA Arizona Division Office Uses Technology Transfer (T2) Funds to Create Local Agency Grant Program


Roadway Safety Issue, Problem, or Gap:

Roadway departures account for approximately half of all fatal crashes nationwide. Pavement edge drop-off has been linked to many serious and fatal roadway departure crashes; drivers who leave the roadway may overcompensate by steering too hard, causing a vehicle to fishtail, swerve into another lane, or completely leave the roadway. The Federal Highway Administration (FHWA) advocates installing Safety Edge™ to mitigate vertical drop-offs. In Arizona, most local agencies did not have the expertise or equipment to include Safety Edge™ on their roadway projects. To address this gap, the Arizona Department of Transportation (ADOT) Local Transportation Assistance Program (LTAP) worked with the FHWA Arizona Division Office to create a program to provide the Safety Edge™ equipment and training to local agencies.

Description of Practice

I think part of it (Local Agency Safety Edge™ Grant Program) was time-consuming because we were learning the best ways to structure the program as we go, but in the end I felt it was definitely worth it, because the program was so successful! Our program had 15 devices, all of which but two have been given to agencies, and more Tribes are interested.

Kelly LaRosa, FHWA Arizona Division

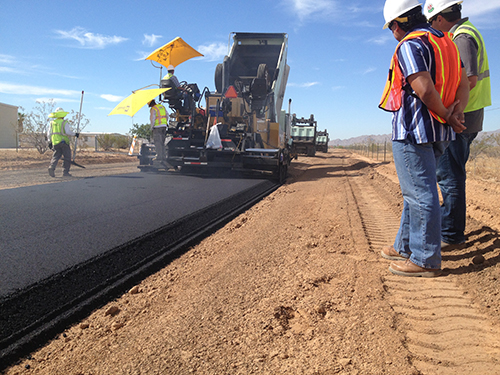
The FHWA Arizona Division Office used Technology Transfer (T2) funds from the Division of Field Service Regional Offices to purchase fifteen Safety Edge™ Shoe Devices exclusively for local agencies, allowing Safety Edge™ to be more broadly implemented throughout the state. Agencies submit an application to receive a Safety Edge™ Shoe Device and training.

The Division Office and the ADOT-LTAP actively promoted Safety Edge™ at industry meetings/conferences and at MPO and Council of Government meetings. ADOT LTAP also built up its internal capacity by participating in Safety Edge™ Train-the-Trainer events.

Key Accomplishments and Results:

  • Increased knowledge and awareness about Safety Edge™ at local agencies, including among Tribes.
  • Increased use of Safety Edge™ in new paving projects. Contractors are marketing Safety Edge™ to their clients, offering it with paving projects, and support the safety benefits.
  • Encouraged innovation applying the technology. Some local agencies have incorporated Safety Edge™ with a thickened edge design detail. One agency, Santa Cruz County, is pursuing a shoulder widening project and adding Safety Edge™ by milling the existing roadway a few feet.
"Photograph of a paving crew laying down a coat of asphalt"
Figure 1: Maricopa County, AZ Note


Contact

Brian Hurst
Tennessee Department of Transportation
615-741-2208
Brian.Hurst@tn.gov

Knox and Oldham Counties in Kentucky Use High Friction Surface Treatments to Reduce Occurrence of Road Departure Crashes – Kentucky

Original publication: Every Day Counts Project Case Study: High Friction Surface Treatments – Kentucky Transportation Cabinet (KTC)(PDF, 816kB)


Key Accomplishments

Roadway departure crashes composed nearly 70 percent of the crashes on Kentucky highways. Because these crashes tend to lead to injury or death, the Kentucky Transportation Cabinet (KTC) decided to treat these problem curves as top priority. For any half-mile roadway section having eight or more wet weather crashes over a 5-year period, the KTC proactively applied High Friction Surface Treatment (HFST) using calcined bauxite for the aggregate if the pavement was in good condition.

Results

Oldham County applied HFST in 2009 to treat one horizontal curve. Prior to the HFST, there were 53 wet weather crashes and three dry weather crashes observed over a 3-year period (18.67 average crashes/year). After the treatment, five wet weather crashes and no dry weather crashes were observed over a period of 3.18 years (1.57 crashes per/year).

Knox County installed HFST at one intersection in 2011. The HSFT was installed to address rear-end crashes at the intersection. The friction treatment was only applied on US 25 in the southbound lane, which has a downgrade approach. For a 3-year period prior to the installation, there were six wet weather crashes and 27 dry weather crashes (11 crashes/year). The crashes were mostly rear-end crashes. During the 1.3 years after the installation, there were two wet weather crashes and five dry weather crashes (5.38 crashes/year).

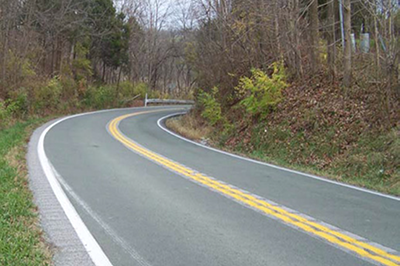
"Photograph of a horizontal curve on KY 22 with HFST installed""Photograph of a horizontal curve on KY 22 with HFST installed"

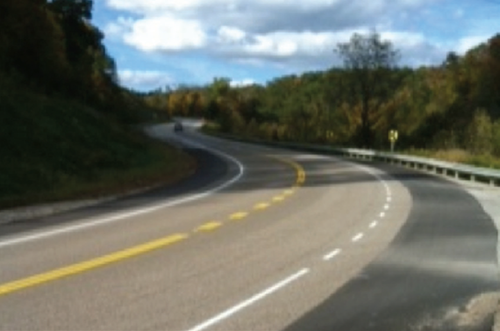
Figures 1 and 2. Oldham County, KY; KY 22, MP4.36 4.44; HFST Installed In August 2009 to Treat One Horizontal Curve

"Photograph of US 25 Southbound Lane, showing an area being installed with HFST""Aerial photograph of US 25 at its Intersection with KY 1629"

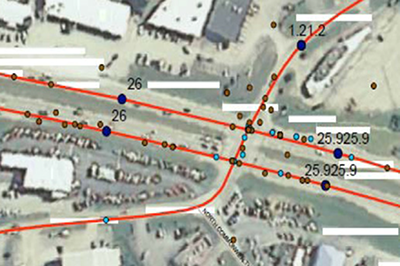
Figures 3 and 4. Knox County, KY; US 25 Southbound Lane, at its Intersection with KY 1629 - HFST Installed In April 2011

Contact

Tracy Lovell
P.E., Transportation Engineer
Kentucky Transportation Cabinet
Tracy.Lovell@ky.gov

Joseph Cheung
P.E., HFST Lead
FHWA Office of Safety
Joseph.Cheung@dot.gov

Wirt and Mercer Counties in West Virginia Use High Friction Surface Treatments to Reduce the Occurrence of Road Departure Crashes – West Virginia

Original publication: Every Day Counts Project Case Study: High Friction Surface Treatments – West Virginia Department of Transportation(PDF, 814kB)


Key Accomplishments

West Virginia has a high number of run-off-the-road crashes. Their goal of applying High Friction Surface Treatment (HFST) at these locations is to reduce the number of crashes. They intend to look at the total number of accidents 3 years after application.

Results

WV DOT officials will look at the total number of accidents 3 years after the application of these HFST treatments.

WV 14 in Wirt County is a typical two-lane road in West Virginia with an ADT of 3400. The site is located at a six-degree horizontal curve. Prior to application, this site had four wet weather crashes in a span of 3 years. No skid testing reading was available prior to the project, but it had a reading higher than 69 after installation. The project was completed in October 2012. The total linear feet of installation is 420.

WV 20 in Mercer County is a two-lane road in southern West Virginia with an ADT of 7200 compromising mostly of commuters. The site is located at a series of horizontal curves. Prior to the application, this site had four run-off-the road crashes in a span of 3 years. No skid testing reading was available prior to the project, but it had a reading higher than 69 upon project completion. The project was completed in August 2011. The total linear feet of installation is 2,200.

"Photograph of an HFST-treated horizontal curve of WV 14 in Wirt County"
Figure 1. Wirt County - WV 14 at MP 15.48


"Photograph of an HFST-treated section of WV 20 in Mercer County"
Figure 2. Mercer County - WV 20 at MP 16.42 between Princeton and Athens, WV


Contact

Donna Hardy
P.E., Mobility and Safety Engineer
WV Division of Highways, Traffic Engineering Division WV DOT
Donna.J.Hardy@wv.gov

Joseph Cheung
P.E., HFST Lead
FHWA Office of Safety
Joseph.Cheung@dot.gov

California Department of Transportation Installs High Friction Surface Treatment on Los Angeles On-Ramp to Reduce Wet Pavement Collisions – California

Original publication: Every Day Counts Project Case Study: High Friction Surface Treatments – California Department of Transportation(PDF, 615kB)


Key Accomplishments

Caltrans Roadway Departure Safety Plan in 2011 identified 179 locations and approximately 50 other locations where High Friction Surface Treatment (HFST) has been or will be placed.

California has placed 10 HFST applications to date. However, 50 additional applications are planned, including one at a high-speed, signalized intersection. The majority of the applications will be for the end of on-ramps and on the curves of two-lane roadways.

"Photograph of the Sepulveda onramp"
Figure 1. Rte. 105 Sepulveda Boulevard onramp in Los Angeles, CA. HFST installed in February 2011


Caltrans is moving forward with the projects as a result of information obtained from other states and information provided during webinars. Based on the information from webinars, Caltrans' specifications call for calcined bauxite only. Previously, Caltrans mainly used open-grade asphalt concrete (OGAC) to reduce wet pavement collisions along with grinding and grooving. However, OGAC could not be installed at locations where there were freezing temperatures. An additional benefit of HFST when compared with OGAC is the ability to install on any pavement surface without concern for cross drainage.

Results

The I-105 Sepulveda Blvd. on-ramp, a primary egress point from the Los Angeles Airport, was notoriously closed during rain events to prevent expected crashes. The average daily traffic is 31,000. Crashes occurred as a result of the tight curvature, the low friction, and aggressive driving by motorists. The closure of this highly utilized ramp resulted in numerous complaints to Caltrans. The latest five years of crash data showed that 68 of the 85 crashes were wet pavement crashes. Since Caltrans applied HFST to about 1,300 linear feet of the ramp, it has not been closed. The pre- and post-application friction values were 32 and approximately 60, respectively. Due to the volumes of crash data processed, post-application crash experience data is not available at this time.

Contact

Robert Peterson
Branch Chief, Caltrans
Highway Safety Improvement Program
Robert.Peterson@dot.ca.gov

Joseph Cheung
P.E., HFST Lead
FHWA Office of Safety
Joseph.Cheung@dot.gov

Safety Warrants and Spot Safety Index

Original publication: HSIP Noteworthy Practice Series, HSIP Project Identification; FHWA-SA-11-02; 2011(PDF, 2.7MB)


The North Carolina Department of Transportation (NCDOT) started to identify shortcomings in its problem identification method in the mid-1990s. The previous method focused on identifying locations with a potential safety issue based on factors such as crash frequency, crash rate, and crash severity. In many cases, the locations identified did not exhibit a correctable crash type and were congestion related issues. For example, NCDOT repeatedly identified signalized intersections exhibiting a high frequency of rear-end collisions, but attributed the collisions to congestion and driver inattention rather than a roadway factor.

Intersection Warrants:

I-1: Frontal Impact

I-2: Last Year Increase

I-3: Frequency with Severity Index Min

I-4: Night Location without Streetlight

I-5: Chronic Pattern

Section Warrants:

S-1: Run Off Road- Wet Conditions

S-2: Run Off Road

S-3: Wet Road Conditions

S-4: Non-Intersection Night Location without Streetlight

Bridge Warrant:

B-1: Bridge

Bike/Ped Intersection Warrants:

P-1: Last 3 Years (pedestrians)

P-2: Darkness with Streetlights

P-3: Alcohol Involvement

P-4: Chronic Location

X-1: Last 3 years (bicyclists)

X-2: Darkness with Streetlights

X-3: Alcohol Involvement

X-4: Chronic Location

Beginning with the 1996 HSIP, a set of safety warrants was established for intersections and roadway segments to target locations exhibiting a pattern of correctable crash types or conditions, as well as locations with a significant increase in crash frequency during the past calendar year. NCDOT has continued to expand and modify the safety warrants throughout the years to improve the identification process.

NCDOT initially screens the network (including local roads) for potential safety improvement locations using four categories of safety warrants: intersections, sections, bridges, and bicycle and pedestrian intersections. The safety warrants are analyzed annually using 5 to 10 years of crash data by querying the crash database. The current warrant criteria are based on crash frequency, severity, conditions, and percentage of target crashes. When a location meets the warrant criteria, it is flagged. As an example, an interstate segment would be flagged based on run-off road crashes if a minimum of 30 total crashes occurred on the segment, the crash rate is greater than 60 crashes per mile, and a minimum of 60 percent of the total crashes were run off the road. After a location is flagged, a weighting factor is calculated based on the warrant criteria. The weighting factors are summed for locations meeting multiple warrants and are used to rank locations to determine which will receive priority for further analysis and investigation by the corresponding Regional Traffic Engineering and Highway Division staff. The Regional Traffic Engineers are responsible for identifying potential countermeasures and developing projects.

All safety projects are submitted to North Carolina’s Safety Oversight Committee, which was established to help select projects to receive Spot Safety Program funding. To provide clear and consistent data-driven selection process, the Spot Safety Index (SSI) was developed as a decision support tool to perform an initial prioritization of all candidate projects from across the state. It ensures safety investments are focused on locations with the greatest need and potential for improvement. The SSI is calculated based on a 100-point scale and is composed of four parts: Safety Factor (60 points), Constructability (5 points – e.g., ROW acquisition needs), Department Goals (5 points) and Division/Region Priority (30 points). The Safety Factor is based on the benefit-cost ratio, Severity Index, and whether the project is identified in the HSIP List or identified through a Road Safety Audit (RSA). An initial list of prioritized projects is developed by ranking projects based on the SSI. However, the Committee must take other considerations into account to develop the final list, including distribution of funding to the 14 districts and the effectiveness of countermeasures identified in the projects based on results from the state’s evaluation group.

Key Accomplishments

  • Developed network screening method to identify locations with severe and correctable crash patterns.
  • Continued to update network screening process to improve the identification of relevant safety issues and locations.
  • Developed systematic project prioritization ranking method that considers benefit-cost analysis, departmental and regional priorities, and ease of constructability.

Results

The development of the safety warrants for use in the network screening process has enabled NCDOT to focus their analysis on the identification of locations with severe crashes and crash patterns correctable by infrastructure safety countermeasures. NCDOT also has successfully established a clear and consistent data-driven process for selecting and prioritizing projects for funding.

Contact

Stephen Lowry
Safety Improvement Engineer
North Carolina Department of Transportation
919-773-2892
slowry@ncdot.gov
Alabama Flexes HSIP Funds for Increased Enforcement

Original publication: HSIP Noteworthy Practice Series, Use of the HSIP Flexible Funding Provision; FHWA-SA-11-02; 2011(PDF, 2.8MB)


Thirty percent of speeding crashes and 60 percent of roadway departure crashes occur on the 11,000 miles of Alabama’s state highway system. According to Wes Elrod, Transportation Planning and Modal Programs Assistant Bureau Chief, a review of the data and current countermeasures indicated a need for increased enforcement.

Until the flex funding option became available in FY 2006, the Alabama Department of Transportation (ALDOT) did not have a mechanism to provide direct financial assistance to the Department of Public Safety (DPS) for increased enforcement on the state system. The Highway Safety Office (HSO) distributes a significant proportion of its National Highway Traffic Safety Administration (NHTSA) funds to local governments and only a limited amount to DPS. Recognizing limited resources for traffic enforcement, ALDOT used HSIP flex funds to increase enforcement strategies identified in the strategic highway safety plan (SHSP) addressing behavior to complement infrastructure improvements and more effectively reduce roadway departure crashes. ALDOT flexed between five and eight percent of its HSIP funds annually from FY 2007 to FY 2010, resulting in $1.5 to $2.8 million spent on noninfrastructure safety projects each of the past four years.

The majority of the flex funds paid for overtime for state police troopers to conduct speed enforcement activities, which is a strategy in the state SHSP Risky Driving Emphasis Area. ALDOT worked with the state police to determine how much overtime enforcement they could handle given personnel levels and agreed on an appropriate amount of HSIP funds to flex each year.

ALDOT identified fatal and serious injury crash locations and provided crash maps to the state police. Using the Critical Analysis Reporting Environment (CARE) crash records system ALDOT identified the time of day and the type of crashes. Troopers then focused their overtime efforts on those times and locations. ALDOT divided HSIP funds among the 12 state police trooper posts proportionally based on the number of high-crash corridors in each area.

ALDOT closely monitored enforcement results and made adjustments as necessary. In quarterly reports, the state police provided the hours worked by each trooper and citations issued during overtime enforcement periods. ALDOT continuously evaluated results to ensure safety goals were met and whether the effort was a successful countermeasure for reducing both speeding and lane departure crashes.

"ALDOT 2004-2008 color-coded Run-off-the-Road, Fatal & Type A Injury Crashes map and legend"

Key Accomplishments

  • Strengthened the partnership with Department of Public Safety, which is a member of the SHSP Executive Committee.
  • Implemented an enhanced data-driven program of enforcement on the state highway system.
  • Took advantage of joint crash data system to provide crash maps and time of day information to DPS.
  • Increased the efficiency of state law enforcement by funding improved radar and GPS devices.

Results

Flexing HSIP funds for use by DPS for enforcement has resulted in a strong partnership between the state police and ALDOT staff, while addressing noninfrastructure emphasis areas from the SHSP. This effort has resulted in increased deployment of enforcement resources on the state highway system based on crash data. From 2007 to 2009 the number of fatal crashes involving speeding decreased 31 percent, from 369 in 2007 to 255 in 2009.

Contact

Waymon Benifield
Safety Management Section Administrator
Alabama DOT
Phone 334-353-6404
benifieldw@dot.state.al.us

Wes Elrod
Assistant Bureau Chief, Modal Programs
Alabama DOT
Phone: 334-353-6407
elrodw@dot.state.al.us