
Cheryl Walker, Associate Administrator for Safety.
Sign up to have Safety Compass delivered right to your inbox!

Best for printing: PDF Version (1.5 MB)
In this issue:
A Message from the FHWA Associate Administrator for Safety, Cheryl Walker
What's New
FHWA 2022 Safety Discipline Awards
New Final Rule Reduces Administrative Burden on State DOTs
Update on the National Roadway Safety Strategy (NRSS) Implementation
Safety-Driven Changes and Improvements
Consistently Improving Nighttime Visibility of Pavement Markings
Commuter Authority Rail Safety Improvement Program Round 2 (CARSI 2) Awards $59M to Four States
Funding Tribal Transportation Safety Improvements That Save Lives
Improving Vulnerable Road User Safety through the Highway Safety Improvement Program (HSIP)
Learning Together
News from Vision Zero Communities
Will Technology Solve All Our Road Safety Challenges?
FHWA Helps California Crowdsource Best Practices for a Comprehensive Traffic Count Program
Data and Analysis
SPF-R Online — Making Performance Function Development Easier and More Accessible
Safety Data and Analysis Case Studies: How Do States Turn Data into Results?
New Resource Roundup
Announcements
What is the Tribal Motor Vehicle Safety Summit?
Coming Soon! EDC-7's Nighttime Visibility for Safety
Upcoming Conferences and Events
Visit the FHWA Office of Safety Booth #736 in the TRB Exhibit Hall!
Cheryl Walker, Associate Administrator for Safety.
In 2021, an estimated 42,915 lives were lost on U.S. roads. Early estimates for the first half of 2022 show similar numbers of people dying on our roadways, although the second quarter of 2022 saw a heartening decline — the first decline in fatalities after seven quarters of year-to-year increases in fatalities. While a decline is exactly what we need, the fatality numbers are still at high levels that call for immediate action. In response to this crisis, in January of 2022, the U.S. Department of Transportation launched the National Roadway Safety Strategy (NRSS), which features the Safe System Approach as its guiding paradigm. We know that we need safer roads, safer vehicles, safer speeds, safer drivers, and highly effective post-crash care to reduce the number of fatalities.
All USDOT surface modes are committed to turning around the trend in traffic fatalities and serious injuries on our roadways, and we are all dedicated to implementing the actions outlined in the NRSS to move us closer to our zero deaths goal. This past year, FHWA launched a Complete Streets Initiative that prioritizes the safety of all users and released critical Highway Safety Improvement Program guidance documents. FHWA is also working to update the Manual on Uniform Traffic Control Devices and is implementing the new Safe Streets and Roads for All (SS4A) grant program. You can follow our progress on the NRSS Dashboard. See the “Update on the National Road Safety System (NRSS) Implementation” article on page 4 for more information.
This issue of Safety Compass Newsletter is filled with articles that feature how the FHWA Office of Safety and our partners are working together to save lives on our roads. In this issue, you can read about how States are using HSIP to improve the safety of vulnerable road users, peruse updates from several Vision Zero communities, check out a report from the Tribal Motor Vehicle Safety Summit, learn how to best use the new ped/bike transit guide, and look ahead to the new EDC-7 safety initiative that focuses on nighttime visibility.
The NRSS articulates priority actions that target our most significant and urgent safety challenges to have the most substantial impact. We invite you to learn more about these efforts and to join us to help save lives on our Nation’s roads.
By Cheryl Walker, FHWA Office of Safety
Congratulations to this year’s winners of the FHWA Safety Discipline awards!
Field Leadership Safety Award
Karla Petty (Arizona Division Administrator) has had a lifelong career dedicated to FHWA and safety since joining FHWA in 1983. Under Karla’s leadership, beginning in calendar year 2022, the Division Safety Specialist presents to the Arizona DOT leadership during their monthly coordination meetings on a quarterly basis. This presentation is impacting safety issues at the highest levels. She also is a strong safety advocate within the Division by implementing a standing “Safety Moment” at staff meetings and encouraging crosscutting efforts across disciplines on several safety initiatives. Arizona DOT’s director recently stated, “Karla is a tireless champion for traffic safety in Arizona. Karla does not just come to the table with advice. Karla brings real-world experience along with a mind that is always open to innovation. Among State leaders, Karla seamlessly weaves in national safety efforts and focuses us all on traffic safety at all government levels and the different travel modes.”
The passion for safety Karla has demonstrated throughout her career has fostered cultural change across the State and Nation, helping establish strong safety relationships that remain today and embrace innovative approaches to reducing injuries and fatalities.
Field Safety Peer Awards
Matthew Hinshaw (formerly of Western Federal Lands, now with FHWA Office of Safety) has developed new ways to use GIS and crowdsourcing to improve safety. He has also worked to develop training and procedures to implement systemic safety and data-driven safety analysis within Federal Lands Highways. Matt has planned and developed safety countermeasure training for design engineers and has worked to expand the use of IHSDM analysis and roadside benefit/cost analysis. Matt’s ability to build partnerships with many stakeholders across disciplines and agencies was key to getting these and other efforts off the ground. He is able to bring together people from many different disciplines, not only within FHWA but also externally—local, State, Federal Lands Management Agencies, consultants, etc. His initiative and passion for safety is evident in all the work he does.
John Miller’s (Missouri division safety engineer) mission is safety and everything related to saving lives within highway safety, traffic, and operations program areas. John is a Missouri champion for pedestrian safety and has made significant advancements in promoting and implementing innovations such as the Safe System Approach and the Every Day Counts (EDC) initiatives, especially Safe Transportation for Every Pedestrian (STEP). John is a leader in the advancement of safety initiatives and works tirelessly with the Missouri DOT and local public agencies to advance safety activities from vision to institutionalization. John is never afraid to take the lead and jump into a project with both feet. While John is a born leader, he prefers to use those skills to teach and encourage our State partners to achieve lasting safety improvements. The State of Missouri is indebted to John for his continued commitment to and passion for saving lives.
Dr. Wei Zhang (Office of Safety and Operations Research and Development) is noted for his leadership and creativity to improve intersection/interchange safety, including: developing innovative designs, creating enhanced treatments at intersections and mini-roundabouts for improved vulnerable road user safety, investigating possible intersection-related crash causes using the Naturalistic Driving Study, and exploring cutting-edge applications with intersection edge-computing technologies to promote the Small Business Innovation Research program. He serves on numerous national committees and research projects and is often praised for his technical expertise and up-to-date situational awareness of complex issues focusing on intersection/interchange safety. The results of all his efforts have led to several designs and tools that have been implemented in the field and have saved lives.
Howard A. Anderson Safety Lifetime Achievement Awards
Michael Griffith (recently retired from the FHWA Office of Safety) has had a distinguished 33-year career with USDOT. Virtually all his time has been dedicated to the advancement of safety programs, countermeasures, and knowledge aimed at reducing the toll of fatalities and serious injuries on U.S. roadways. He served in the Office of Analysis, Research and Technology in the Federal Motor Carrier Safety Administration, the Office of Safety Research and Development in FHWA, and the FHWA Office of Safety. Mike has been a safety leader and champion who has devoted his career to advancing innovative approaches to address safety. He has always made himself available to safety discipline members to simply answer questions or to provide broader program or career guidance. In considering his full career, Mike is very deserving of this career achievement recognition.
Cate Satterfield (FHWA Office of Safety) has more than 32 years of service to the safety profession at FHWA, and during this time, she has been a steadfast champion of safety. Over her career, Cate has served in the Office of Safety, the RC Safety and Design Team, Central Federal Lands, and division offices. Cate displayed exceptional leadership as the Safety Edge team leader during the first EDC initiative and was successful in moving the Safety Edge technology to the institutionalized stage with State transportation agencies across the country. Over the past several years, she has co-led the EDC-5 FoRRRwD initiative, overseeing development of informational guides, case studies, LRSPs, and educational videos. Cate has proven leadership skills that she has demonstrated in leading the effort for successful establishment and implementation of a sign assessment or management method for maintaining minimum levels of sign retroreflectivity. Cate has also led the development of the recent rulemaking to establish a standard for maintaining minimum retroreflectivity of longitudinal pavement markings. Cate is a member of the Safety Discipline who has contributed to safety advancements through her commitment to public service over many years, undoubtedly resulting in lives saved.
By Rick Drumm and Sarah Weissman Pascual, FHWA Office of Safety
On October 11, 2022, FHWA published the final rule amending its regulation found in 23 CFR Part 192 concerning drug offender’s driver's license suspension. This regulation implements 23 U.S.C. 159, which encourages States to enact and enforce drug offender’s driver’s license suspensions. It applies to each State and specifies the steps that States must take to avoid the withholding of Federal-aid highway funds for noncompliance with the certification requirements.
The Final Rule
The final rule aligns with the wording of the legislation and reduces the administrative burden on States. The changes make the annual certification process more efficient, which benefits States and FHWA division offices. While these changes reduce the administrative burden on States, they will not compromise safety on our Nation’s roads.
For example, the final rule allows a governor’s designee to certify instead of a governor. It also allows certifications to occur only when there has been a change in law or status, rather than annually.
FHWA published the Notice of Proposed Rule Making on February 18, 2022 and received several comments. Most commentors expressed agreement that the proposed changes would reduce the administrative burden on States, with none expressing opposition to the regulatory proposal.
Additional Changes
FHWA updated the language to require States to submit an electronic copy of the certification to its respective FHWA Division Administrator. FHWA also updated the penalty withholding amount from 10 to 8 percent to be consistent with current legislation, set new timeline requirements for when certifications are required, and clarified that withheld funds will be unavailable for apportionment and will lapse immediately.
In addition, FHWA revised the procedures affecting noncompliant States. For States that fail to notify FHWA within 90 days of the effective date of a change, FHWA will advise them of funds expected to be withheld approximately 90 days before the beginning of the fiscal year. The final rule also permits States to submit documentation demonstrating their compliance, which gives States an opportunity to rectify noncompliance prior to funds being withheld.
For more information, please contact Sarah Weissman Pascual at sarah.pascual@dot.gov or Rick Drumm at rick.drumm@dot.gov.
By Norah Ocel, P.E., PMP, and Jennifer Warren, FHWA Office of Safety
The USDOT NRSS is approaching its 1-year anniversary, so you may be asking: What steps is USDOT taking to implement the NRSS?

NRSS dashboard. (Source: FHWA)
As articulated in the NRSS, USDOT is committed to the ambitious long-term goal of reaching zero roadway fatalities and is dedicated to implementing the actions outlined in NRSS to move us closer to this goal.
Each USDOT mode whose roles and responsibilities include roadway safety is making significant progress toward advancing specific action items in the NRSS to make our roadways safer for everyone. Now you can follow their progress through the NRSS Action Tracking Dashboard that was launched this past October.
The dashboard shows progress by the NRSS Safe System areas of Safer People, Safer Roads, Safer Speeds, Safer Vehicles and Post-Crash Care.
From education, training, and technical assistance to implementing policies, rulemakings, and regulations, USDOT is striving to make a difference. Visit the dashboard and the NRSS website for regular updates.
USDOT has a responsibility to make our roadways safer for everyone, but the success of the NRSS will require a commitment from everyone. In conjunction with the NRSS, USDOT will be starting a Call to Action for stakeholders to commit to specific actions that will significantly advance safety. Stay tuned for more to come!
For more information, please contact Jennifer Warren at Jennifer.Warren@dot.gov.
By Paul Jodoin, James Austrich, and Joseph Tebo, FHWA Office of Operations
For decades, transportation agencies have leveraged coordinated, multidisciplinary efforts to detect and respond to traffic incidents with a goal to clear roadways faster. As a by-product of clearing roadway incidents faster, TIM seeks to reduce secondary crashes and the exposure of incident responders. The operations focus always has safety at its heart—as do all aspects of engineering—but safety has increasingly become the focus for TIM.
TIM is embodied in the objectives of the NRSS, and specifically in the actions of responders and care of individuals after a crash occurs.
TIM is embodied in the objectives of the NRSS, and specifically in the actions of responders and care of individuals after a crash occurs. Improving responder and motorist safety through TIM training and TIM technology deployment are key actions of the NRSS and are actions that are tracked by the NRSS dashboard.
TIM Training
Advancing incident safety begins with safer people. The National TIM Responder Training program has trained more than 600,000 traffic incident responders, such as police, fire, emergency medical services, transportation, and towing organizations. Through those efforts, the people responsible for managing incidents are operating on a common footing with proven and standardized approaches designed to make them and others safer.
The National TIM Responder Training program is delivered in classroom and online formats, as well as in an instructor-led virtual approach that has boosted the number of trainers around the country. Most important, feedback from students overwhelmingly reinforces the value of the training for advancing responder safety.
TIM Technology
Technology presents one of the biggest opportunities to advance TIM. Through FHWA’s Every Day Counts (EDC) program, State and local agencies have been embracing next-generation TIM technologies that improve safety by warning approaching road users, improving responder situational awareness, and improving responder efficiency.
Communicating appropriate driving maneuvers (i.e., reduce speed, move over a lane) with drivers approaching traffic incident scenes is a principal way that TIM can advance safety. Smart emergency lighting systems intelligently manage the color, pattern, intensity, and flash rate of emergency vehicle lights to communicate with approaching motorists more effectively. Similarly, new temporary traffic control devices can warn and direct drivers with lights and sequential flash patterns. Response vehicle-mounted message and arrow boards capable of displaying directional information and caution messages are complimentary to these technologies.
A host of technologies improve the exchange of information among road users and the roadway environment. Information can be delivered to in-vehicle systems or smart devices that are used by occupants, such as:
A queue or backup of traffic often accompanies roadway incidents. Queues can be very dangerous areas for secondary crashes, particularly rear-end type crashes. Responders are taught to be mindful of queues and to protect the scene as well as provide advanced warning to motorists. Detection and warning alerts help mitigate the dangers that drivers experience when approaching incident scenes. Strategically placed queue warning vehicles, detection of queue messages using crowdsourced traffic data and traveler information systems, and delivery of warnings to drivers using applications and in-vehicle alerts are some of the motorist-alert technology strategies used to communicate with drivers.
Situational awareness among TIM responders helps them work safer at incident scenes. Positioning a response vehicle between the incident scene and approaching traffic is referred to as a protective block. It is a critical TIM element, even when the protective block is on the roadway shoulder. Making incident scenes “harder” involves intrusion-alert technology, truck-mounted attenuators (TMA), autonomous protective vehicles, and similar treatments. A separate transportation agency truck or surplus fire apparatus vehicle outfitted with a TMA can provide an effective barrier that protects downstream responders.
Video-sharing technologies allow cameras mounted on service patrol vehicles to stream images from incident scenes to transportation management centers (TMCs), as well as allow responders to view TMC images. Sharing video enhances the ability of responders and TMC operators to evaluate incidents, plan their responses, and identify the need for additional resources.

Automated debris removal system. (Source: Enforcement Engineering, Inc.)
Time is a critical element in terms of safety because it is equated to exposure for responders and everyone involved. The quicker roadways can be cleared, the safer everyone can be. Unmanned aerial systems (UAS), sometimes called unmanned aircraft systems, are small aircraft remotely piloted to capture video and photographs. When used with traffic incidents, UAS are an effective tool for law enforcement to expedite measurement and mapping of serious crash scenes. They also help with incident verification, response routing, queue detection, secondary crash detection, and detour route monitoring.
Roadway debris removal is a hazardous part of responder actions, particularly for safety service patrols and roadway maintenance crews who typically pick up debris by hand. Manual removal makes operators vulnerable pedestrians, while automated debris removal systems attached to response vehicles enable removal while driving over the debris. Like UAS, automated debris removal systems help make responders more efficient at incident scenes.
The FHWA Office of Operations, FHWA Office of Safety, and various sections of the National Highway Traffic Safety Administration (NHTSA) have been collaborating to solve the safety conundrum at traffic incident scenes. Current work is assessing responder-struck-by data, examining secondary crash data, and determining how drivers move over when approaching roadside events. New efforts to improve traffic crash data are designed to promote the collection of secondary crashes and responder-struck-by incidents, both of which are now in the Model Minimum Uniform Crash Criteria.
TIM is an important part of the NRSS. Effective TIM can improve not only the care of individuals after a crash occurs, but also the safety of responders and motorists. TIM training and TIM technology deployment are key to filling this important safety objective.
For more information contact James Austrich at james.austrich@dot.gov, Paul Jodoin at paul.jodoin@dot.gov, or Joseph Tebo at joseph.tebo@dot.gov.
By Marc Starnes, FHWA Office of Safety, and Kevin Elliott, ARA
Marc Starnes made a mistake. As a statistician for the Federal Highway Administration, he knows how close he came to losing his life.
“I was 19 years old and was driving a 15-passenger van with no passengers. A friend of mine was driving immediately behind me.”

First Responders at the crash. (Source: News & Observer Publishing Co. / Durham Herald)
Then the crash.
“I was going too fast and overshot the off ramp,” Marc said. “I exited the highway and I lost control.”
Marc’s vehicle landed on top of the guardrail, then skidded nearly 100 yards straddling the guardrail toward a bridge, where the van hit a short concrete pillar head on.
“I was knocked unconscious immediately. If my friend had not witnessed the crash while driving behind me, I would have no idea what happened.”
After hitting the pillar, the van did a frontal rollover and then rolled sideways many quarter turns down a hill back toward the main freeway. By this point, all the van’s windows and the windshield were shattered.
Luckily, the rolling van hit a large exit sign at the edge of the freeway that, though crushed, stopped the van and held it up just high enough to prevent it from crushing Marc.
“As bad as it was, I know safety countermeasures helped save my life,” Marc said.
Do you have a story to share or know someone in your organization whose life was saved by safety treatments or whose career was inspired by a safety story?
If so, we want to feature your story!
Please contact Chimai Ngo at chimai.ngo@dot.gov.
Marc did not walk away unscathed, however. He suffered brain trauma from the 1990 crash that led to eight years of monthly grand mal seizures beginning in January 1993. After medications failed to stop his epilepsy, he had a surgery late in 2000 that removed part of his brain and stopped the seizures.
As a technical professional who survived a horrific crash, Marc understands firsthand the complex nature of real crashes and the need for the Safe System Approach. The Safe System Approach is a holistic philosophy to road safety that acknowledges human mistakes and vulnerability, then designs the transportation system to allow for those frailties without fatal consequences.
“We’ve come a long way in highway safety since my crash in the early nineties,” Marc said. “We’ve implemented a large number of life-saving countermeasures over the years. Vehicles now have airbags, electronic stability control, and so many other safety features. I’m heartened by the fact that restraint use has increased tremendously over the years. I regret that I was a less careful driver at age 19, but as a result of this crash, I am a much safer driver today. But we must continue to anticipate and accommodate human mistakes. We must account for the dynamic, unpredictable nature of severe crashes. We must continue our efforts to build up a safe roadway system.”
Learn more about the Safe System Approach at the FHWA website.
Learn more about an epilepsy support group Marc founded at their website.
By Cate Satterfield, P.E., FHWA Office of Safety
Have you ever had a difficult time seeing where your lane is while driving at night? If so, you aren’t alone. Markings are usually easy to see at night when they are first installed. However, over time, the elements embedded in the markings that make them redirect light from your headlights back to your eyes get dirty or dislodged. Inadequate pavement marking retroreflectivity is one reason that traffic fatalities are three times more likely to occur at nighttime compared to daytime.

Roadway at night. (Source: FHWA)
By refreshing pavement markings before they become inadequate for nighttime driving, transportation officials can assist drivers in safely navigating. The Manual on Uniform Traffic Control Devices now includes minimum maintained levels of retroreflectivity for longitudinal markings such as center lines, edge lines, and lane lines. The new provisions provide flexibility for agencies in how they achieve these maintained levels of retroreflectivity, with five different methods that have been described in the supplemental guidance document, Methods for Maintaining Pavement Marking Retroreflectivity. The methods include options to measure, visually inspect, or use service life information.
The document also includes an appendix with step-by-step examples of how to develop each method. The goal is to assist smaller agencies, or those with less retroreflectivity experience, in developing a method appropriate for their specific agency. FHWA hosted a webinar on this topic in September (use passcode V=nj*f0 to access the recording). FHWA is also developing video resources to assist agencies.
Agencies will need to use the method they’ve developed by September 6, 2026. FHWA provided this long compliance period due to concerns raised by agencies about the time needed to develop their processes, purchase equipment, and obtain additional resources (such as staffing, funding, and training) before they begin using their method.
For additional information, please visit FHWA’s nighttime visibility website or contact Cate Satterfield at cathy.satterfield@dot.gov.
By Esther Strawder, FHWA Office of Safety
On September 21, 2022, FHWA’s Acting Administrator announced selectees for the CARSI 2 grant program. The program provides $59,744,250 in competitive grants to eligible commuter rail authorities in California, New York, Pennsylvania, and Florida for railway-highway crossing-safety activities described in 23 U.S.C. 130(a). Eligible commuter authorities must have experienced at least one accident investigated by the National Transportation Safety Board (NTSB) between January 1, 2008, and December 31, 2018, and for which NTSB issued an accident report. Eligible projects include those that separate or protect grades at crossings, rebuild existing railroad grade-crossing structures, relocate highways to eliminate grade crossings, and eliminate hazards posed by blocked grade crossings due to idling trains.
Under CARSI, FHWA (in coordination with the Federal Railroad Administration and Federal Transit Administration [FTA]) rated the proposed project’s ability to eliminate hazards at railway-highway crossings. The projects that received a CARSI 2 grant were also selected based on their ability to improve rail safety while promoting equity and sustainability and considering climate change. The selected projects will also improve vulnerable road user accommodations and replace functionally obsolete equipment at rail crossings.
With the recent upward trend of crashes occurring at railway-highway crossings, this much-needed Federal investment in commuter rail grade-crossing safety will protect pedestrians, reduce crashes, and save lives in urban, rural, and underserved communities.
For more information, please contact Esther Strawder at esther.strawder@dot.gov.
By Adam Larsen, FHWA Office of Tribal Transportation

Hannahville Indian Community pedestrian infrastructure on Hannahville Road. Completed in 2018 with a TTPSF Grant of $746,495. (Source: Betty Draze, employee of HIC)
Native Americans are more likely to lose their lives in roadway crashes than any other group in our country. This is what makes the funding of 58 projects with $8.9 million for fiscal year (FY) 2021 through the Tribal Transportation Program Safety Fund (TTPSF) so crucial. Additional funding available for FY 2022–26 will further advance efforts to reduce roadway deaths.
A complete list of FY 2021’s grant recipients is available online. The funding opportunity builds on efforts to improve the safety of our Nation’s roadways. These 58 projects run parallel to the SS4A discretionary grant program that was also funded under the President’s Bipartisan Infrastructure Law (BIL) (Public Law 117-58).
The TTPSF was developed to reflect feedback from Tribal transportation leaders. As a result, Tribes can apply for funding at 100-percent Federal share with no matching requirements to implement projects categorized as:
Additional information on how to apply for future funding rounds can be found on the TTPSF website.
For more information, please contact Adam Larsen at adam.larsen@dot.gov.
By Karen Scurry, FHWA Office of Safety
The Infrastructure Investment and Jobs Act (also known as BIL) included a new requirement under the HSIP for States to develop a Vulnerable Road User Safety Assessment. On October 21, 2022, FHWA published guidance to provide background and clarify the requirements for the Vulnerable Road User Safety Assessment.
As part of the Vulnerable Road User Safety Assessment, each State will conduct a quantitative analysis of vulnerable road user fatalities and serious injuries using data and considering demographics to identify areas as high risk to vulnerable road users. States will then consult with local governments and other stakeholders to develop a program of projects or strategies to improve the safety of vulnerable road users in the high-risk areas. Provided below is a summary of noteworthy practices and resources to support the development of the Vulnerable Road User Safety Assessment.
Using Quantitative Analysis to Identify High-Risk Areas
Data-driven safety analysis is not new to the States or the HSIP. All States should already have a safety data system in place with the ability to perform safety problem identification and countermeasure analysis, and to differentiate safety data for vulnerable road users from other road users as part of States’ HSIPs. States can use this system and other data to identify areas as high risk to vulnerable road users through either spot or systemic safety analysis.
NCHRP Research Report 893 provides a safety analysis method that can help proactively identify sites for potential safety improvements based on specific risk factors for pedestrians using systemic pedestrian safety analysis. The report presents several pedestrian crash risk variables for analysis, as well as multiple case examples that apply the method in both State and local agencies. This method would enable transportation agencies to identify, prioritize, and select appropriate countermeasures for locations with a high risk of pedestrian-related crashes (i.e. high-risk areas), even when fatality and serious injury crash data are sparse.

Children are vulnerable road users waiting at a crosswalk. (Source: www.pedbikeimages.org / Dan Burden)
The Virginia Pedestrian Safety Action Plan uses both crash cluster analysis and systemic/predictive analysis to identify potential locations for pedestrian safety improvements. In addition to safety data, the systemic/predictive analysis also includes census block data (e.g. zero-vehicle households, population below poverty line, population density) as risk factors. This comprehensive approach is consistent with current HSIP practice and incorporates equity-related factors into the decision-making process.
Consulting Local Governments and Engaging the Public through Various Techniques
States will consult with local governments and other stakeholders that represent the high-risk areas. Many different examples of engagement techniques for gathering input from local governments and stakeholders are outlined in Promising Practices for Meaningful Public Engagement in Transportation Decision-Making, published in October 2022 by the Office of the Secretary. These techniques include charettes, focus groups, open houses, surveys, and workshops. Many agencies have successfully used these techniques for vulnerable road user-related activities.
The North Jersey Transportation Planning Authority sponsors walkable community workshops. The workshops train participants to identify barriers to walking and improve pedestrian safety in each workshop community. These workshops include:
Several other metropolitan planning organizations conduct walkability assessments under grants supported by the Centers for Disease Control and Prevention. This would be a great way to partner with regional and local governments to gather input on safety needs and potential solutions for the identified high-risk areas in the Vulnerable Road User Safety Assessment.

Cover of the Massachusetts plan. (Source: Massachusetts DOT)
Other agencies have engaged the public in all aspects of plan development. The City of Rohnert Park, California, is developing a local road safety plan (LRSP) and has created a project website and an interactive map that allows community members to view collisions in the area and provide location-specific comments. The city also conducted a project survey and hosted virtual public meetings. The director of public safety even included an article in the Community Voice to promote the LRSP and encourage the public to become engaged.
Consultation and public engagement also seem to be common for State bicycle and pedestrian plans. As part of the Massachusetts Bicycle Transportation Plan, the State obtained input both in-person and online. The plan states, “Public input is critical for answering questions about why people choose to bike or not, where they want to bike when they do, common barriers to biking, and notable bike network gaps.” Massachusetts DOT collected feedback in several ways, such as hosting listening sessions and open-streets events, producing a downloadable partner toolkit for stakeholder groups to solicit input from their members, creating a web-based interactive map, developing an online survey, and facilitating a social media campaign to publicize feedback opportunities.
The California Department of Transportation (Caltrans) used a three-phase approach to gather input for its Toward an Active California – State Bicycle and Pedestrian Plan. During phase 1 Caltrans gathered information on challenges, opportunities, and priorities to help identify objectives and strategies. This was accomplished through regional forums, online surveys, and stakeholder focus groups. Throughout phase 2 Caltrans used public workshops, Tribal listening sessions, and a questionnaire to seek input and feedback on draft objectives and strategies. Phase 3 includes public review of the draft plan via public workshops, public webinars, and online comments.
A common theme across these examples is that each agency uses multiple approaches to gather input. This emphasizes the importance of establishing a process for consulting with local governments and other stakeholders that represent the high-risk areas identified through the Vulnerable Road User Safety Assessment. The FHWA Office of Planning website outlines a step-by-step process to support the design of a public involvement program, which may be helpful to States as they consider approaches to meet the consultation requirement.
Developing a Program of Projects or Strategies

Pedestrians waiting at a crosswalk. (Source: www.pedbikeimages.org / Dan Burden)
Based on the outcomes of the consultation and considering the Safe System Approach, each State is required to develop a program of projects or strategies to improve the safety of vulnerable road users in the identified high-risk areas. When considering a Safe System Approach, States should prioritize projects and strategies that align with the goal of eliminating fatalities and serious injuries. The guidance outlines a hierarchy, or tiered approach, as follows:
Projects and strategies that separate users in space have the greatest potential to reduce fatalities and serious injuries first, as physical separation can permanently eliminate conflicts that lead to severe crashes. If it is not feasible or appropriate for the roadway context to separate users in space, agencies can consider combining supplemental treatments from lower tiers where feasible, which promotes redundancy of Safe System solutions. Many of the FHWA Proven Safety Countermeasures fit in one or more of these categories. In addition, the Complete Streets design model implements the Safe System Approach.
The program of projects and strategies for the Vulnerable Road User Safety Assessment may not degrade transportation system access for vulnerable road users. For example, rather than removing a midblock crossing after crashes occur, an agency should make these crossings safer for pedestrians by adding high-visibility markings, rapid rectangular flashing beacons, or similar countermeasures.
The Vulnerable Road User Safety Assessment can also include a review of agency policies to identify areas that can be addressed to improve decision-making for vulnerable road user safety. These policies should ensure that vulnerable road user safety is prioritized in all aspects of program and project delivery.
Getting to the Finish Line
States’ initial Vulnerable Road User Safety Assessments are due November 15, 2023 and are to be appended to their respective Strategic Highway Safety Plans (SHSPs). Future updates of the assessments will occur as part of States’ regular SHSP update process. For additional information:
In addition, a limited amount of free technical assistance for the assessments is available to State DOTs. Contact tamara.redmon@dot.gov for more information.
By Chimai Ngo, FHWA; Kevin Fehr, City of Daly City, CA; Lisa Foster, City of Alameda, CA; Abi Subramanian, City of Denver, CO; and Ella Froggatt and Kris Carter, City of Boston, MA
Every day, Vision Zero communities across the country make extraordinary efforts to enhance the safety of all road users. These efforts include community outreach, engineering countermeasures, routine activities, and out-of-the-box interventions on small to large scales. The ultimate purpose is to save lives on the roadways and reach the goal of zero traffic-related deaths and serious injuries. Below are examples of current efforts among Vision Zero communities.

Vision Zero logo for Daly City. (Source: Daly City, California)
Daly City’s Vision Zero Outreach Campaign
A community’s decision to adopt Vision Zero marks the start of a journey that will certainly include physical changes, such as crosswalk enhancements and lowering speed limits. Becoming a Vision Zero city is integrating Vision Zero into the community. Safer People is a part of the Safe System Approach to Vision Zero that focuses on the safety of all users, including the need for knowledge of what Vision Zero is all about. The City of Daly City, California, recently embarked on its Vision Zero outreach campaign. This marketing effort is helping to brand Daly City’s Vision Zero efforts and to make Vision Zero a familiar part of the city’s safety culture. The city originally adopted its Vision Zero goal in 2016 and adopted its Vision Zero Action Plan in 2020 with funding support from and in partnership with FHWA. Its outreach program began in May 2022 and is a year-long, city-led effort.
Daly City’s campaign has already developed a program logo and adopted the tagline, “Vision Zero: Safe Streets Save Lives.” The city is currently finalizing branding materials that will feature positive safety messaging alongside images of participating community members. The program is funded in part by a 50-percent grant from its county transportation agency, the San Mateo County Transportation Authority, with the remaining funds provided by Daly City. Current activities from the marketing push include social media content, a new Vision Zero web page, hosting information tables at community events, promoting Vision Zero elements of capital projects, and creating a Vision Zero safety video. Outreach will continue through the first half of 2023 with development of school curriculum materials, more community and business outreach, and continued public education. The Daly City Vision Zero Outreach Program is helping the city not only execute a handful of its Vision Zero Action Plan action items, but also reach its stated goal of using Vision Zero’s collaborative and data-driven approach to eliminate fatalities and serious injuries by 2035.

Vision Zero logo for Alameda. (Source: Maurice Ramirez, Alameda, California)
Alameda's Active Transportation Plan
The City of Alameda, California, recently released its final draft Active Transportation Plan, which it developed in tandem with its Vision Zero Action Plan. Because people walking, wheeling, and biking are disproportionately vulnerable in crashes, creating safer facilities for them helps Alameda achieve its Vision Zero goal to eliminate traffic fatalities and severe injuries by 2035. The Alameda City Council adopted a Vision Zero Action Plan in late 2021, including an extensive crash data analysis and safety actions for all modes. The Active Transportation Plan relies on the bicycling and walking findings of that crash analysis. Together, the programs and actions of both plans support building safe facilities for people of all ages and abilities, as well as providing safety education.
To have the safest bikeways and the greatest impact on mode shift, the Active Transportation Plan proposes shifting the percentage of low-stress bikeways from 50 to 75 percent of the network and doubling the city’s bikeway network mileage. The city already has many projects in the pipeline to make its streets safer and more attractive to people walking and biking. In 2023 alone, between city and State transportation agency projects (and benefiting from Federal funds), the city will begin construction on its first modern roundabouts, convert more than 3 miles of four-lane roads to three-lane roads, install almost 2 new miles of protected bike lanes, and upgrade pedestrian crossings at dozens of intersections. The projects proposed in the Active Transportation Plan will build on these and other projects to create connected and comfortable networks for active transportation.

Vision Zero logo for Denver. (Source: Denver, Colorado)
Denver’s Rapid Response Program
Since the launch of the Vision Zero Action Plan in 2017, Denver’s Department of Transportation and Infrastructure (DOTI) has implemented many safety-focused initiatives to eliminate traffic-related deaths and serious injuries. One such effort is the Rapid Response program, which consists of a small team of DOTI employees and partners at the Denver Police Department. The Rapid Response team meets regularly to investigate recent fatal crashes and determine using historic crash data what treatments—engineering, education, enforcement, or a combination of the three—are appropriate at crash locations. Treatments can involve immediate quick-build improvements, such as changing signal phasing or adding signs and pavement markings. Treatments can also involve including the crash site as a part of a larger-scale, long-term project such as a signal rebuild. Regardless of what the outcome may be, the Rapid Response team works to determine the contributing factors to a crash and pair them to the appropriate Proven Safety Countermeasure.
The Rapid Response team has reviewed every fatal crash in Denver since the program launched. Since the beginning of 2020, the team has recommended more than 50 signage, pavement marking, and signal timing and phasing engineering work orders. The city and county of Denver use social media or targeted enforcement to implement recommendations related to education or enforcement. A great example of a rapid response success story is the interchange at 20th Street and Interstate 25, where Denver previously had a high frequency of crashes—especially crashes involving impaired drivers. The Rapid Response team worked with Colorado DOT to improve signage and with the police department to increase enforcement. Crashes decreased by 33 percent after the treatments had been implemented. The City of Denver is currently conducting a 5-year review of the Vision Zero Action Plan and gearing up to release a second edition of the plan. The Rapid Response program has been a success and remains a crucial part of the action plan moving forward.
Please view Denver’s Vision Zero dashboard for the latest updates.

City logo. (Source: Boston, Massachusetts)
Boston’s Large Vehicle Safety Project
The City of Boston, Massachusetts, received a grant from the Partnership for Healthy Cities to help tackle safety issues posed by large vehicles on city streets, as described in a pair of reports by the National Association of City Transportation Officials and the Volpe National Transportation Systems Center (Volpe). Large trucks and buses often have large blind zones that make it challenging for drivers to see people walking, rolling, and riding bikes near them. Newer designs provide drivers with more direct vision through reduced height cabs, expanded windows, and sloped or flat-faced hoods. Although these designs are available in some markets, they have not been widely adopted yet.
The city will use a portion of the grant to fund technical support by Volpe to develop a scoring system to assess the visibility of vehicles on the market. Boston and other cities will be able to use the scoring system to compare visibility when making large vehicle purchases. The grant also supports the work of MassBike and LivableStreets Alliance to raise awareness of blind zones and develop training materials for drivers of city fleet vehicles. The training will also cover new types of bike and pedestrian infrastructure and their purpose, as well as laws and best practices related to sharing city streets with people walking and rolling.
For news from other Vision Zero communities, visit https://highways.dot.gov/safety/zero-deaths/news-vision-zero-communities or contact Chimai Ngo at chimai.ngo@dot.gov.
By Norah Ocel, P.E., PMP, and Karen Timpone, FHWA Office of Safety
Generally, road safety engineers are trained to focus on four things:
The Safe System Approach, as embraced by the NRSS, has revealed a need to look not only at how the five Safe System Approach elements (Safer Roads, Safer Vehicles, Safer Road Users, Safer Speeds, and Post-Crash Care) collectively interact, but also how technology can play a role in improving road safety.

Safe system approach diagram. (Source: FHWA)
With agencies experiencing rising infrastructure costs, communities are looking at innovative technology solutions to improve safety. Connected vehicle, automated vehicle, and infrastructure technologies will be the trend of the future. As communities start to change their street design approach by implementing Complete Streets, making technology part of the conversation becomes more important than ever.
Technology is not only being researched, developed, tested, and piloted to potentially save thousands of lives, but it is also being permanently deployed in many places. Technology needs to be a part of the roadway safety conversation. Where road safety infrastructure and behavioral countermeasures fall short, technology could bridge the gap. For example, there is ongoing in-vehicle technology research that will help when road users decide to drive while intoxicated. This technology has the potential to dramatically help reduce fatalities on our roadways by up to 30 percent.
FHWA’s Turner-Fairbank Highway Research Center has developed an entire research program around intelligent transportation system (ITS) technologies that supports safety, efficiency, and communication networks. These networks include connectivity-based vehicle-to-pedestrian systems, pedestrian wayfinding and navigation guidance, and bike and shared-street signage.
An example of technology that has been piloted is the Connected Vehicle Pilot Deployment Program. The program deployed applications using data captured from multiple sources (e.g., vehicles, mobile devices, and infrastructure) across all elements of the surface transportation system (i.e., transit, freeway, arterial, parking facilities, and tollways) to support improved system performance and enhanced performance-based management.
Safer Road Users
The City of Marysville, Ohio, has a smart mobility corridor where intelligent infrastructure has been enabled to improve safety for vulnerable road users with global positioning system coordinates and thermo cameras to track pedestrians. ITS monitors and analyzes camera metadata and broadcasts personal safety messages to connected vehicles and generates basic safety messages for nonconnected vehicles that can be used on dynamic message signs.
Safer Vehicles
There are many advanced driver assistance systems (e.g., pedestrian detection/avoidance, lane departure warning/correction, traffic sign recognition, automatic emergency braking, and blind spot detection) that help drivers with maneuvering intersection movement, left turning, and merging. Additionally, some cellular phones can identify when a vehicle has crashed based on the deceleration of the vehicle.
Post-Crash Care
The ability to clear incidents quickly while providing safety to on-scene responders and travelers is one measure of the success of a TIM program. The successful on-scene activities are supported by interagency communications and technology when adequate warning is provided to motorists approaching the incident queue (advanced traveler information systems) and positive traffic control is provided at all incident scenes on a 24–7 basis (advanced traffic management systems).
Safer Speeds
Many agencies already use reduced speed zones, work zone warnings, dynamic speed harmonization, and curve speed warning systems. Agencies can also make more use of speed safety cameras (SSCs) to supplement more traditional methods of enforcement, engineering measures, and education to alter the social norms of speeding. SSCs use speed measurement devices to detect speeding and capture photographic or video evidence of vehicles that violate a set speed threshold. SSCs can be deployed in many forms, including:
Safer Roads
In 2021 the City of Bellevue, Washington, began applying traffic conflict analysis to its high injury network (HIN) corridors. Traffic conflict analysis leverages cloud computing, artificial intelligence (AI), and video analytics to offer predictive insight into when, where, and why crashes are most likely to occur. Integrating conflict analytics into road safety assessments, the traffic conflict analysis then identifies and prioritizes projects.
Technology and Safety

Smart Community Resource Center webpage. (Source: FHWA)
Technology should be part of the safety conversation among road safety engineers when it comes to safety, infrastructure, roadway departure, intersection safety, speed management, and pedestrian and bicyclist safety improvements. Joint review and implementation of infrastructure countermeasures and technology deployments need to happen simultaneously in many cases, as they can complement each other. Technology has a positive impact on road safety and enhances mobility for all. Vehicle-to-everything technology is important at intersections and key locations where there are safety concerns, such as curves and grade crossings, evacuation routes, and special event areas.
Looking for more technology resources and information? Visit the Smart Community Resource Center, which was designed to connect States, Tribal governments, and local communities with resources that can be used to develop ITS and smart community transportation programs.
So, is technology going to solve all our road safety challenges? We know there is no single solution but deploying safety technologies will be critical to our success in reaching zero fatalities and serious injuries more rapidly. There is no time to spare!
For more information, please contact Norah Ocel at norah.ocel@dot.gov.
By Sarah Weissman Pascual, FHWA Office Safety
Caltrans received technical assistance under FHWA’s Safety Data and Analysis Technical Assistance Program (SDATAP) to learn about other States’ successful practices in traffic volume data collection, management, and use.
Background and Motivation
Caltrans wanted to develop a sampling methodology to derive estimated annual average daily traffic values on all functional class roads as part of the agency’s Consolidated Safety Data Plan. This included identifying new potential sources of data (i.e., emerging probe and connected vehicle technologies, as well as implementing a statewide bike and pedestrian count database).
In April 2022, Caltrans, FHWA, and the SDATAP team assessed how States are addressing the Model Inventory of Roadway Elements (MIRE) traffic data requirements, particularly on local roads. In July 2022, the SDATAP team circulated an online survey to seven State DOTs: Missouri, Minnesota, North Carolina, New Jersey, Colorado, Washington, and Nevada. Six of the seven agencies responded to the survey. The survey asked these agencies for their insights on the technology, data management, quality control, and interagency cooperation required to collect local vehicular, pedestrian, and bicycle count data. The questions were grouped into seven priority topics for Caltrans:
Key Takeaways
At the aggregate level, several themes emerged. Applications of emerging concepts (AI/ML, big data, data management methods, etc.) of interest to Caltrans also interested the other DOTs. Missouri and New Jersey noted some experience with these methods, but, unfortunately, none of the States have detailed practical implementation experience yet. However, that may change within the next year.
Planning is essential for a successful program. Agencies pursuing an expanded or revised count program should understand what they want to learn from the data. This requires coordination among several departments within a DOT, including traffic, planning, and geographic information system (GIS) staff. This will help States establish key network coverage needs and effectively obtain non-motorized user data.
Perhaps unsurprisingly, the information on costs and level of effort varies widely among the States. This is partly due to how the States differ in the ways they structured their count programs. It is also partly due to how much effort the States put into their QA/QC programs, and the process when a count is found to be in error (e.g., throw the data out or replace it with a calculated value). This may vary in elapsed time, as some immediately fix the counter while others may wait until a staff member or a vendor is available to take care of the equipment.
The information on active transportation was promising. Some States are collecting data on non-motorized transportation and doing much with it. Similarly, States are working on incorporating big data methods using a variety of resources, including university-based research partners, vendors, and in-house information technology (IT) staff.
Final Thoughts
At the end of the survey, each State was asked for their final thoughts for States reconsidering their count program. The responding States had the following advice for all States looking to improve their traffic count program:
Missouri – Missouri stressed the importance of including experts from various fields and business units (e.g., traffic, planning, IT, GIS) when building out a program.
Minnesota – Minnesota advised using existing partnerships and integrating efforts with the motor vehicle data collection teams early in the process. Minnesota DOT emphasized covering many networks and facility types in long-duration/permanent and short-duration counts. Finally, agencies should apply for national research funding at every opportunity they can.
North Carolina – Like Minnesota, North Carolina emphasized a broad coverage in its counts, including counting active transportation users such as bicyclists and pedestrians. It is vital for a DOT to understand how it will use the data before starting a program. North Carolina also underscored the importance of appropriate staffing and resources to maintain equipment, and viewing the long-term needs of the program.
New Jersey – New Jersey recommended creating a program that covers a wide array of functional classes throughout different geographical areas. The DOT’s greatest challenge with its count program involved limited data for every type of road, making it difficult to annualize data across functional classes and regions.
Colorado – Colorado advised immediate and transparent communication with technicians as soon as a sensor or counter experiences issues, and Colorado encouraged Caltrans to make politically sensitive locations top priorities for maintenance.
Nevada – Nevada referenced a series of quality checks by staff, including a field analyst, volume analyst, classification analyst, or truck analyst, and then to the traffic management analysis system staff. Nevada encouraged Caltrans to be thorough, invest in quality counts, review the whole system as much as possible, and to not accept bad data.
The technical assistance and survey results will help Caltrans adopt and adapt the successful strategies described by its peers and apply them to California.
For more information, contact Sarah Weissman Pascual at Sarah.Pascual@dot.gov.
By Eric Green, Ph.D., and Paul Ross, Kentucky Transportation Center at the University of Kentucky, and Sarah Weissman, FHWA Office of Safety
Since its release, the Highway Safety Manual (HSM) has facilitated the adoption of new approaches by safety professionals to address highway safety.

SPF-R web interface. (Source: KTC)
Highway safety has traditionally been measured using number of crashes, crash rates, crash costs, or a combination of those metrics. High-crash locations are selected based on a somewhat arbitrary ranking, or by comparison of crash rates to a critical rate factor. All methods have demonstrable disadvantages, particularly in network screening. Most notable, none of these methods account for regression-to-the-mean or selection bias. When observed in crash data, these biases can produce misleading results when not corrected for. Traditional crash analysis relies on crashes normalized by exposure—typically traffic volume—to create a rate. However, the use of rates erroneously assumes a linear relationship between crashes and volume. Most Safety Performance Functions (SPFs) exhibit an exponential relationship between crashes and exposure. SPFs are models used to predict crashes based on traffic volume and other factors.
Network screening using HSM’s methodology addresses many of the disadvantages of the traditional methods. SPFs are developed to better characterize the relationship between crashes and traffic volumes as well as other variables. Empirical Bayes addresses regression-to-the-mean bias by using actual crash data and the overdispersion parameter to adjust the expected crash experience at a site. This adjusted value is a more realistic measure of a site’s safety performance. More important, it describes the magnitude of crash reduction that could potentially be achieved. In Kentucky, this is referred to as excess expected crashes. Other States use “potential for safety improvement” synonymously.
SPFs had to be developed manually in Kentucky until 2017, when the Kentucky Transportation Center (KTC) at the University of Kentucky (UK) introduced a way to do so using the free, open-source statistical software, R. Using methods outlined in the HSM, code was created in R to automate SPF development to improve regression models. The original tool, known as SPF-R, allowed States that hadn’t adopted newer methodologies—due to difficulties related to SPF development—the ability to create SPFs. SPF-R provided immediate feedback in SPF development, including goodness-of-fit measures and depictions of the model. SPF-R was added to the FHWA Safety Toolbox in 2018 and was available on UK’s website. However, it required the user to have a working knowledge of R code and an application downloaded to a computer to run. Recognizing that downloaded programs and running code may be a barrier for some, KTC updated SPF-R in 2022 to run the program entirely online. A new web interface was developed so SPFs could be developed through a user’s web browser by uploading a comma-separated values file containing certain predefined parameters. All of the R code runs online, and in place of scripting and code execution, users can now interact with a simple-to-use web interface. Users of this new tool will have fewer technical challenges getting SPF-R working, as the mechanics are all handled online. For advanced users, the R code is still available to download to modify, demonstrate the mechanics, and use for citation.
SPF-R online is still free and open source, and in this current form is more accessible than before. It may be accessed by visiting https://spfr.uky.edu.
The original SPF-R is available through the FHWA Safety Toolbox at https://safety.fhwa.dot.gov/rsdp/toolbox-content.aspx?toolid=210.
For more information, please contact Eric Green at Eric.Green@uky.edu.
By Jerry Roche and Sarah Weissman Pascual, FHWA

Safety and analysis case study locations. (Source: FHWA)
The FHWA Office of Safety recently developed more than 20 case studies (see map) that describe noteworthy practices for data governance, management, and analysis of the State DOTs and their partner agencies. FHWA completed these case studies in partnership with the Highway Safety Manual Implementation Pooled Fund Study and Transportation Research Board’s (TRB) ACS20 Safety Performance and Analysis User Liaison Subcommittee. Two efforts demonstrated a need for noteworthy safety data and analysis practices:
Meeting the MIRE Fundamental Data Elements (FDE) Requirements
Federal regulations require State DOTs to collect MIRE FDEs—a subset of roadway, intersection, and interchange data elements that supports robust safety management—by September 2026 (23 CFR § 924.11).
Florida’s recent advancements in meeting MIRE FDE requirements have required collaboration across several agencies. A gap analysis revealed MIRE-related data stored across several offices within the DOT, and partnerships among those offices and State universities will help Florida DOT achieve its MIRE FDE goals.
After completing a gap analysis to determine their intersection data needs, Vermont and Ohio developed statewide intersection inventories representing each State’s entire public road network. Linear referencing serves as the foundation for the intersection inventory and will allow these States to maintain data quality for all location-based information.
Connecticut created the Transportation Enterprise Data (TED) warehouse to meet the need for enterprise data. A data governance framework that supports TED helps the State maintain robust safety data management, support advanced safety analysis, and meet other critical department data and analysis needs agencywide.
Robust Data Management Supports Robust Analysis
Numerous case studies demonstrate that safety data are most effective when they are accessible and readily integrable with analysis platforms. Ohio demonstrated the value of formalized interactions among people, processes, and technologies. Ohio DOT established an independent Data Governance Office, led by a newly created chief data officer responsible for executing data governance policies, strategic planning, and institutional change management. Similarly, Florida’s multiyear data governance effort enabled the agency to begin a robust program of safety data collection, integration, and predictive analysis based on the HSM. Arizona focused on the quality of its linear referencing system (LRS) and developed a framework to identify critical issues with its LRS so that the agency can trace systemic issues and correct them programmatically. Arizona DOT also advanced its LRS to improve safety data integration and support advanced use cases in data management and analysis.
MIRE FDEs are important safety data elements, but other contextual data can support systemic and Safe System applications. California’s use of HINs shows how the HIN can be an effective tool for safety planning at agencies of all sizes and capabilities. Massachusetts developed tools and analyses to upgrade the State’s web-based safety data portal, IMPACT, supporting better access to data, capacity, and insights to improve decision-making. These case studies demonstrate the breadth of data that can support a State’s SHSP, as well as make data and analysis more accessible to all stakeholders.
Using HSM in the Real World
Several case studies have demonstrated that:
To make data-driven decisions for the proposed I–94 and US 31 interchange, Michigan used an iterative approach to project development. Michigan DOT used the Interactive Highway Safety Design Model (IHSDM) software to identify a preferred design alternative based on a suite of traffic, safety, and cost considerations. Likewise, Indiana applied State-specific SPFs and crash modification factors using the HSM to predict crashes under “build” or “no build” scenarios along a corridor. Indiana DOT tailored the analysis to reflect local conditions and project-specific challenges, and to document the safety benefits under the build scenario.
Alabama also used IHSDM to assess the safety performance of high-volume, high-speed suburban arterials with respect to pedestrian safety. South Carolina highlights an application of the HSM to support a rural road corridor analysis. Its DOT successfully navigated historical context and local stakeholder preferences, presenting the HSM analysis clearly and concisely to garner public support for the proposed alternatives.
Minnesota’s use of the Enhanced Interchange Safety Analysis Tool (ISATe) as part of a planning study demonstrates that projects do not have to be safety-specific to benefit from safety screening and improvements. Minnesota DOT used ISATe to establish safety as a project priority and help strengthen the benefit/cost analysis of proposed improvements along the corridor. Wisconsin analyzes maintenance projects for potential safety improvement opportunities. When this proactive screening identified an opportunity for safety improvement at an intersection in Racine County, the Wisconsin DOT conducted a streamlined alternatives analysis with IHSDM for short-term and long-term improvements.
Parting Thoughts
These case studies illustrate the challenges encountered by agencies and provide practical solutions to address the challenges for safety data and safety analysis. Robust, repeatable safety analysis relies on robust safety data. Programs that actively engage stakeholders within an agency and meet user requirements tend to have stronger enterprise data systems, and as a result, tend to have expanded analysis capabilities.
For more information, and for all case studies published through FHWA’s Roadway Safety Data Program, see FHWA’s case studies web page or contact Jerry Roche at Jerry.Roche@dot.gov.
By Tamara Redmon, FHWA Office of Safety

Cover of Improving Safety for
Pedestrians and Bicyclists Accessing
Transit. (Source: FHWA)
FHWA and FTA recently released Improving Safety for Pedestrians and Bicyclists Accessing Transit. This new guide is intended for transit agencies, State and local roadway owners, and regional planning organizations. This guide identifies how access to and the use of transit has changed, including the range of modal choices, and addresses the safety of vulnerable road users such as pedestrians, bicyclists, and micromobility users.
The guide includes three fundamentals agencies can use:
Transit agencies may take internal actions to foster a culture of safety, form partnerships with public agencies and public-private organizations, and implement engineering and operational actions to enhance pedestrian and bicyclist safety near transit stations.
The guide highlights the many engineering and operational efforts agencies can make to improve safety for pedestrians and bicyclists who are accessing transit. This section of the guide is divided into transit access and transit stop/station improvements. It provides detailed information (including illustrations, technical specifications, and links to other resources) to help you implement these improvements in your transportation facilities.
A webinar on the new transit guide was held on October 24. You can access the recording here. The webinar discussed details of the guide, why the guide is needed, and tips and best practices for agencies to use in their day-to-day work. The webinar also discussed case studies from Oregon DOT and the City of Pittsburgh/Pittsburgh Regional Transit.
For more information, please contact Tamara Redmon at tamara.redmon@dot.gov.
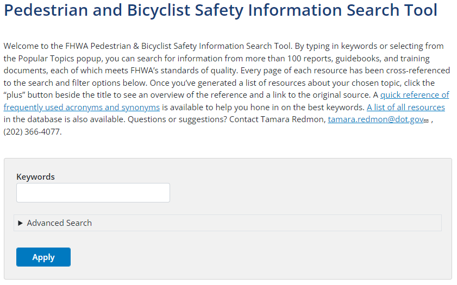
Pedestrian and Bicyclist Safety Information Search Tool.
(Source: FHWA)
By Tamara Redmon, FHWA Office of Safety
The FHWA Office of Safety just launched the updated Pedestrian and Bicyclist Safety Information Search Tool. The tool is a page-by-page assessment of more than 100 carefully selected reports, guidebooks, and training materials. They are cross-referenced by mode, the 4 E’s (engineering, enforcement, education, and emergency services), topics addressed, and other categories. Reports and guidance documents abound for anyone engaged in planning, designing, or advocating for safe pedestrian and bicycle facilities. The information packed into these resources is valuable, but practitioners must track it down from a wide variety of websites, clearinghouses, and printed documents. Not all documents are readily or freely available, and readers must sometimes assess on their own the quality of what they find.
Anyone with a web connection can search the library by typing keywords, picking from drop-down lists, or using other search filters available on the site. Whether you are a community member looking for ways to make your neighborhood safer for kids on bicycles, a researcher studying the application of safety countermeasures, a planner writing a local policy on multimodal safety, or an engineer designing a cycle track, this library can help you find the resources you need.
For more information, please contact Tamara Redmon at tamara.redmon@dot.gov.

2022 summit advertisement. (Source:
Albuquerque Area Indian Health Board, Inc.)
By Adam Larsen, FHWA Office of Tribal Transportation
The Tribal Motor Vehicle Safety Summit is the premier Tribal traffic safety conference dedicated to decreasing death and injury on Tribal lands. This event provides a variety of avenues for Tribes and Tribal agencies to learn, display, and teach their tailored countermeasures in a culturally relevant and sensitive way. We are working together to improve safety and address today’s critical traffic safety issues. The Tribal Motor Vehicle Safety Summit brings together a diverse combination of traffic safety and public health practitioners, advocates, researchers, and future professionals committed to sharing evidence-based practices in a safe, cohesive learning environment. The conference features workshops, peer exchanges, plenary sessions, Tribal vendors, networking opportunities, and more!
The Tribal Injury Prevention Resource Center partnered with NHTSA region 6 and 8 offices to host the 2022 Tribal Motor Vehicle Safety Summit. This year’s event took place November 1–3, 2022, in Denver, Colorado. This in-person event offered child passenger safety continuing education credits and a vendor exhibit hall. Click here for more information or contact Adam Larsen at adam.larsen@dot.gov.
By Tori Brinkly, P.E., FHWA Resource Center Safety & Design Team

Intersection lighting. (Source: FHWA)
The nighttime fatality rate is three times the daytime rate, and 76 percent of pedestrian fatalities occur at night. Enhancing visibility between drivers and other road users will save many lives on our roads.
Many countermeasures and methods exist to improve motorist and non-motorist visibility. Some areas and conditions are more prone to nighttime fatal crashes, specifically at intersections, for pedestrians and bicyclists, and for roadway departure crashes.
The application of cost-effective and proven lighting and traffic control device countermeasures with known safety benefits can help reduce fatalities for all road users.
FHWA has used a focused approach to safety for many years, based on findings that almost 90 percent of the traffic fatalities in the United States happen in three main areas:
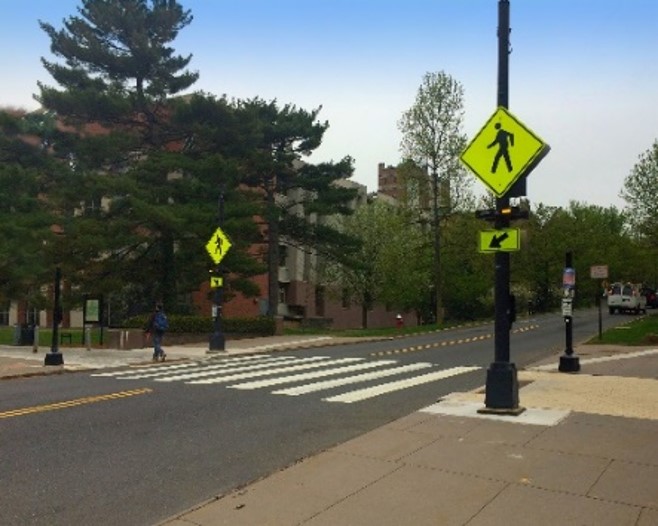
High-visibility crosswalk. (Source: FHWA)
Enhancing visibility in these three areas can address a large part of the nighttime safety problem. The improvements being pursued will range from lighting training and design to traffic control devices for vulnerable users to ensuring these devices can be seen and are effective for all road users.
Available tools include Proven Safety Countermeasures and products, such as those championed by FHWA’s Safe Transportation for Every Pedestrian and Focus on Reducing Rural Roadway Departures initiatives, as well as updated and new tools for lighting design and application of traffic control devices. While many agencies are already using some of these countermeasures, added benefits could be realized through wider implementation…the ultimate goal of EDC.
Learn more about nighttime visibility for safety by attending the EDC-7 virtual summit in February 2023.
For more information, please contact Tori Brinkly at tori.brinkly@dot.gov, Joseph Cheung at joseph.cheung@dot.gov, or George Merritt at george.merritt@dot.gov.
Stay up-to-date on the EDC-7 initiative Nighttime Visibility for Safety. Subscribe to Nighttime Visibility for Safety e-News to receive updates on webinars, case studies, videos and more!
ATSSA Convention & Traffic Expo 2023, February 17–21, Phoenix, AZ.
The theme of this year’s convention and expo is “Where Roadway Safety & Innovation Intersect.” Join roadway safety transportation professionals for the 53rd annual convention.
2023 National Bike Summit, March 26–29, Washington, DC, and online.
The 2023 National Bike Summit will take place March 26–29 in person and online.
2023 Lifesavers National Conference on Highway Safety Priorities, April 2–4, Seattle, WA.
The 2023 National Lifesavers Conference on Highway Safety Priorities brings together a unique combination of public health and safety professionals, researchers, advocates, practitioners, and students committed to sharing best practices, research, and policy initiatives that are proven to work.
NACE Annual Conference, April 16–20, Orange Beach, AL.
The National Association of County Engineers will be gathering in Orange Beach in 2023 for its annual conference to share information and promote awareness of the latest innovations and best practices.
ITE International Annual Meeting and Exhibition, August 13–16, Portland, OR.
This meeting and exhibition is an international membership platform for professionals working to improve transportation mobility and safety.
If you are attending the TRB annual meeting, be sure to stop by booth #736 in the exhibit hall!
Exhibit hours are as follows:
Sunday, January 8, 4–7 p.m.
Monday, January 9, 9 a.m.–4 p.m.
Tuesday, January 10, 9 a.m.–4 p.m.
For more information, please contact Jennifer Warren at Jennifer.Warren@dot.gov.
is a publication of the U.S. Department of Transportation, Federal Highway Administration (FHWA).
FHWA publishes the Safety Compass newsletter 3 times a year. We can be reached at:
FHWA Office of Safety
1200 New Jersey Ave. SE
Room E71-320
Washington, DC 20590
The Safety Compass is available online at the FHWA Office of Safety web site at: https://highways.dot.gov/safety/newsletter/safetycompass/.
We welcome your comments and highway safety-related articles. The purpose of this newsletter is to increase highway safety awareness and information and to provide resources to help save lives.
We encourage readers to submit highway safety articles that might be of value to the highway safety community. Send your comments, questions, and articles for review electronically to Jennifer Warren at Jennifer.Warren@dot.gov.